Original Link: https://www.anandtech.com/show/9518/the-mobile-cpu-corecount-debate
The Mobile CPU Core-Count Debate: Analyzing The Real World
by Andrei Frumusanu on September 1, 2015 8:00 AM EST- Posted in
- CPUs
- Smartphones
- Mobile
- SoCs
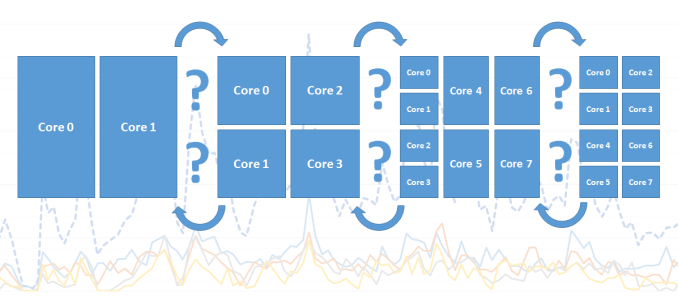
Over the last 5 years the mobile space has seen a dramatic change in terms of performance of smartphone and tablet SoCs. The industry has seen a move from single-core to dual-core to quad-core processors to today’s heterogeneous 6-10 core designs. This was a natural evolution similar to what the PC space has seen in the last decade, but only in a much more accelerated pace. While ILP (Instruction-level parallelism) has certainly also gone up with each new processor architecture, with designs such as ARM’s Cortex A15 or Apple’s Cyclone processor cores brining significant single-threaded performance boosts, it’s the increase of CPU cores that has brought the most simple way of increasing overall computing power.
This increasing of CPU cores brought up many discussions about just how much sense such designs make in real-world usages. I can still remember when the first quad-cores were introduced that users were arguing the benefit of 4 cores in mobile workloads and that these increases were just done for the sake of marketing. I can draw parallels between those discussions from a few years ago and today’s arguments about 6 to 10-core SoCs based on big.LITTLE.
While there have been some attempts to analyse the core-count debate, I was never really satisfied with the methodology and results of these pieces. The existing tools for monitoring CPUs just don’t cut it when it comes to accurately analysing the fine-grained events that dictate the management of multi-core and heterogeneous CPUs. To try to finally have a proper analysis of the situation, for this article, I’ve tried to approach this issue from the ground up in an orderly and correct manner, and not relying on any third-party tools.
Methodology Explained
I should start with a disclaimer that because the tools required for such an analysis rely heavily on the Linux kernel, that this analysis is constrained to the behaviour of Android devices and doesn't necessarily represent the behaviour of devices on other operating systems, in particular Apple's iOS. As such, any comparisons between such SoCs should be limited to purely to theoretical scenarios where a given CPU configuration would be running Android.
The Basics: Frequency
Traditionally when wanting to log what the CPU is doing, most users would think of looking at the frequency which it is currently running at. Usually this gives a rough idea to see if there is some load on the CPU and when it kicks into high gear. The issue with this is the way one captures the frequency: the readout sample will always be a single discrete value at a given point in time. To be able to accurately get a good representation of the frequency one would need to have a sample rate of at least twice as fast as the CPU’s DVFS mechanism. Mobile SoCs now can switch frequency at intervals of down to 10-20ms, and even have unpredictable finer-grained switches which can be caused by QoS (Quality of Service) requests.
Sampling at anything under half the DVFS switching speeds can lead to inaccurate data. For example this can happen in periodic short high bursts. Take a given sample rate of 1s: Imagine that we read frequency out at 0.1s and 1.1s in time. Frequency at both these readouts would be either at a high or low frequency. What happens in-between though is not captured, and due to the switching speed being so high, we can miss out on 90%+ of the true frequency behaviour of the CPU.
Instead of going the route of logging the discrete frequency at a very high rate, we can do something far more accurate: Log the cumulative residency time for each frequency on each readout. Since Android devices run on the Linux kernel, we have easy access to this statistic provided by the CPUFreq framework. The time-in-state statistics are always accurate because they are incremented by the kernel driver asynchronously at each frequency change. So by calculating the deltas between each readout, we end up with an accurate frequency distribution within the period between our readouts.
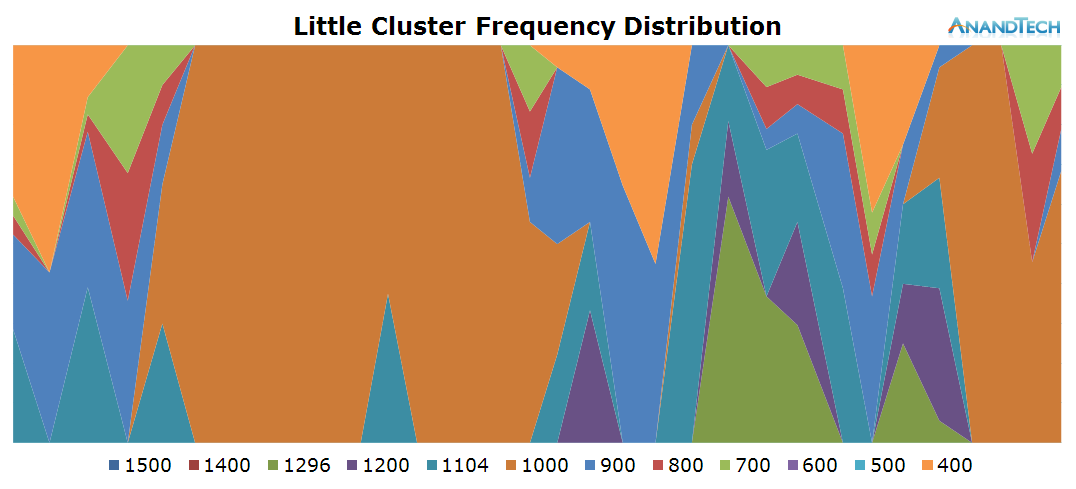
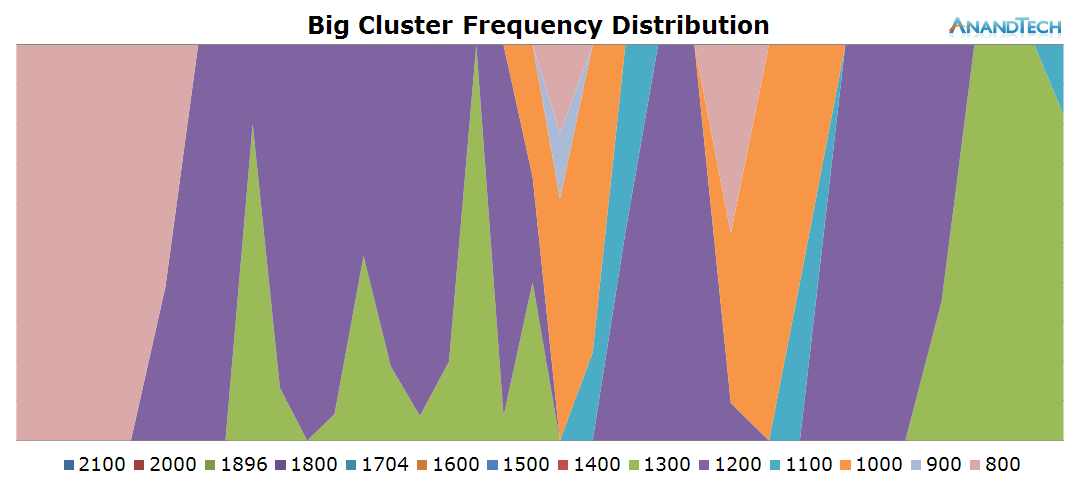
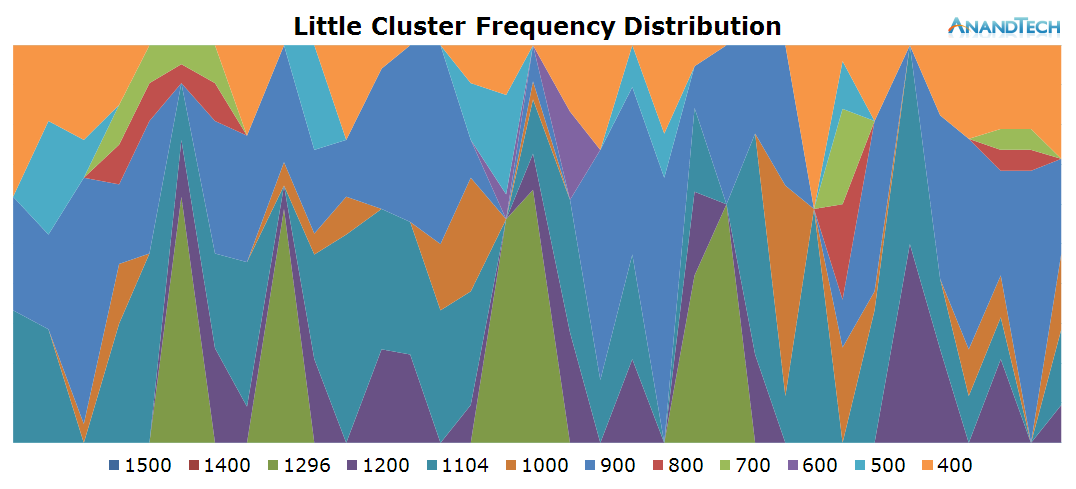
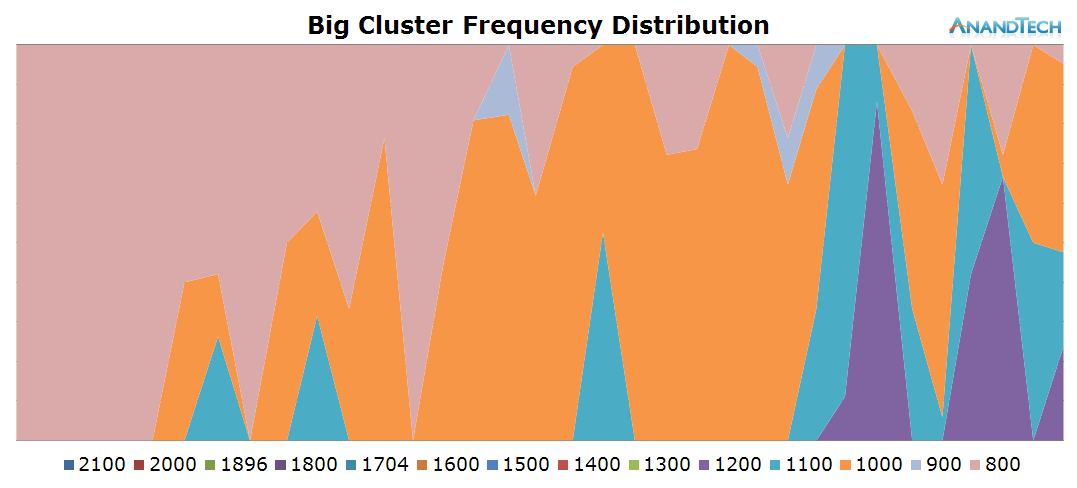
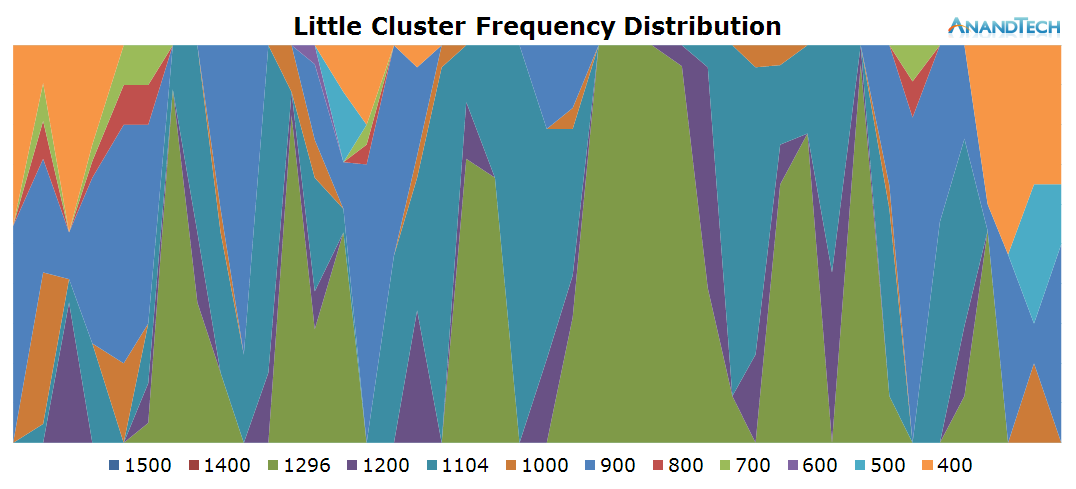
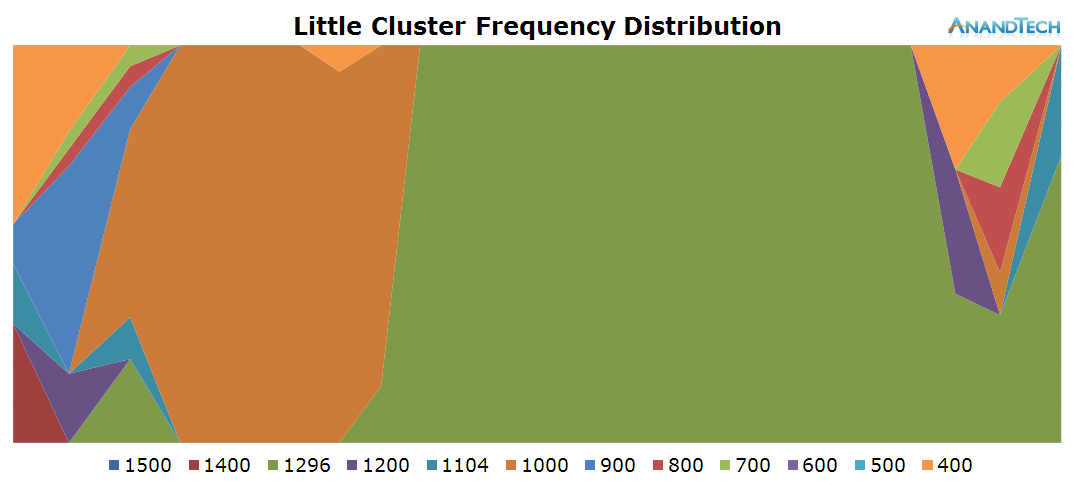
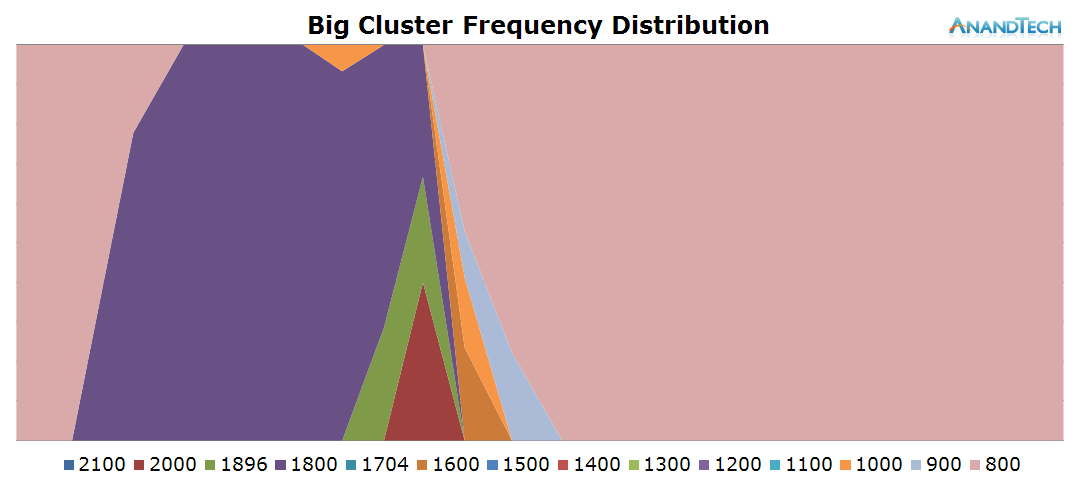
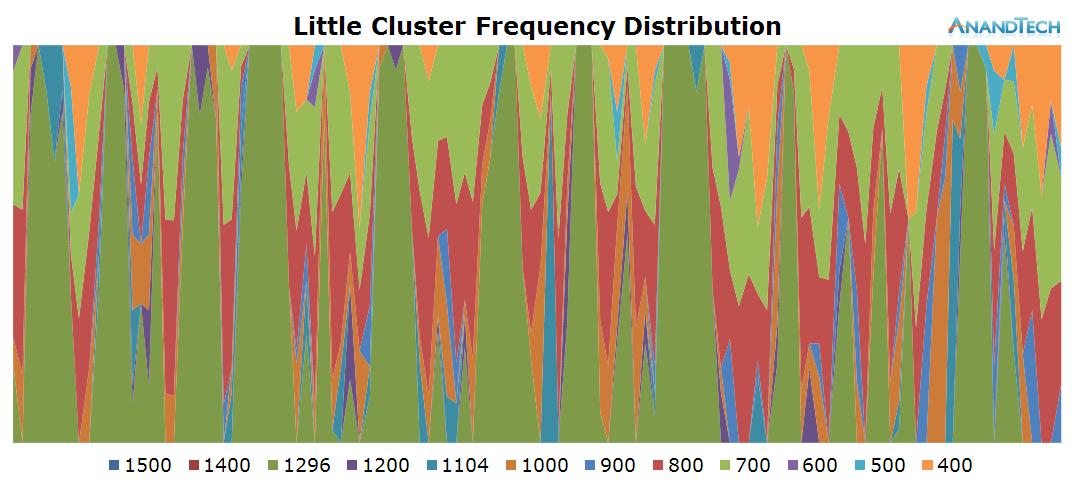
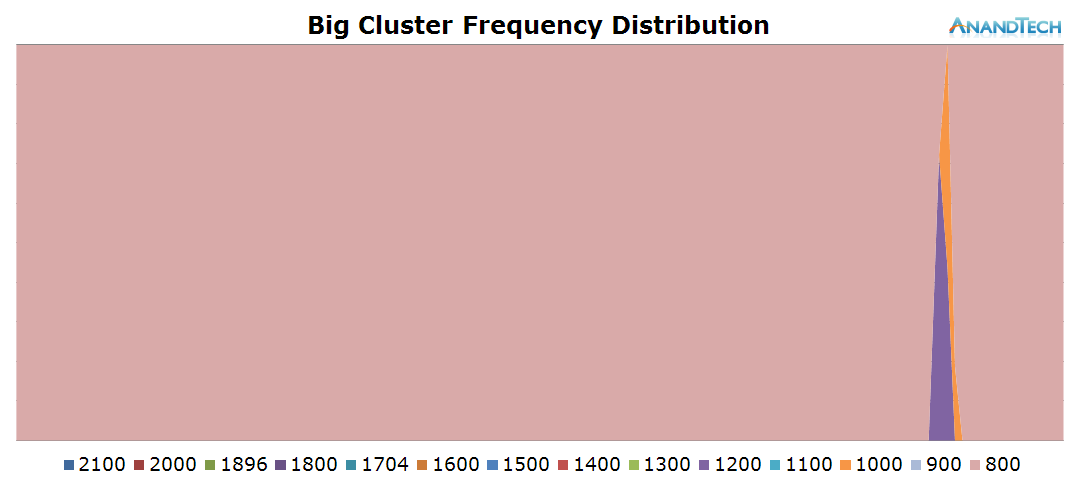
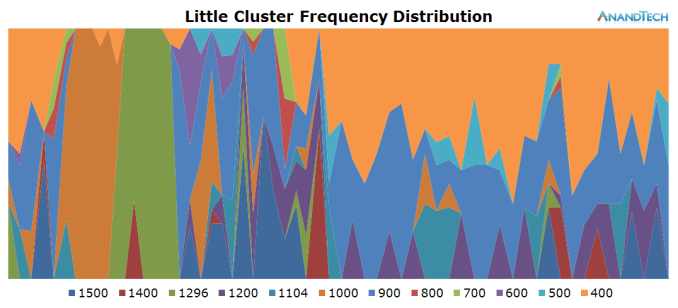
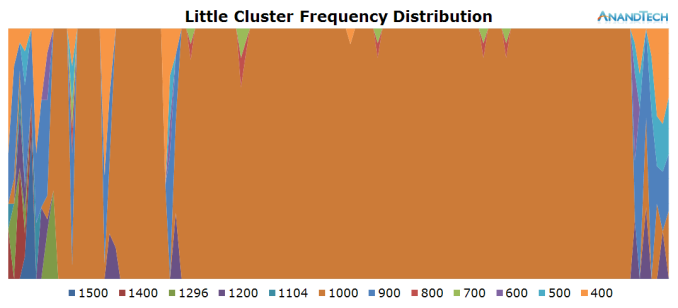
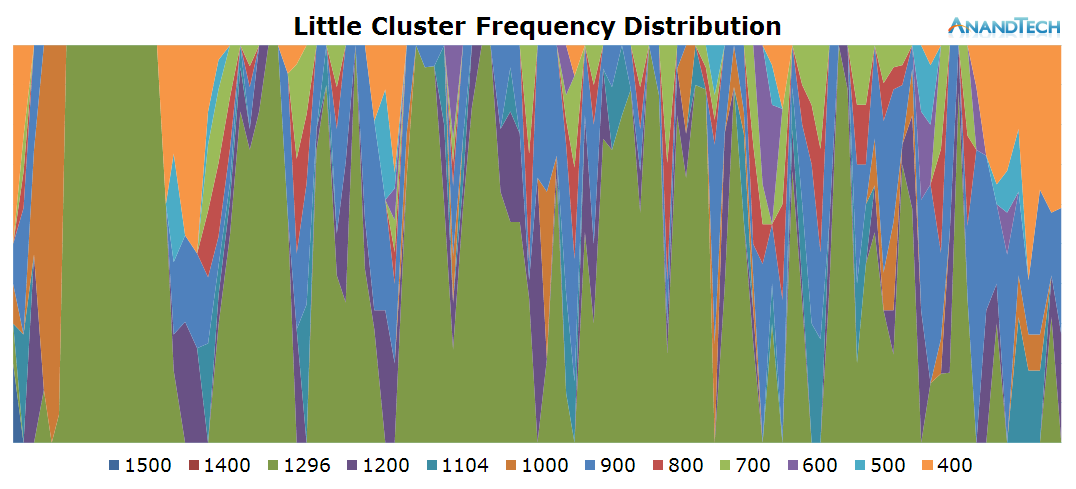
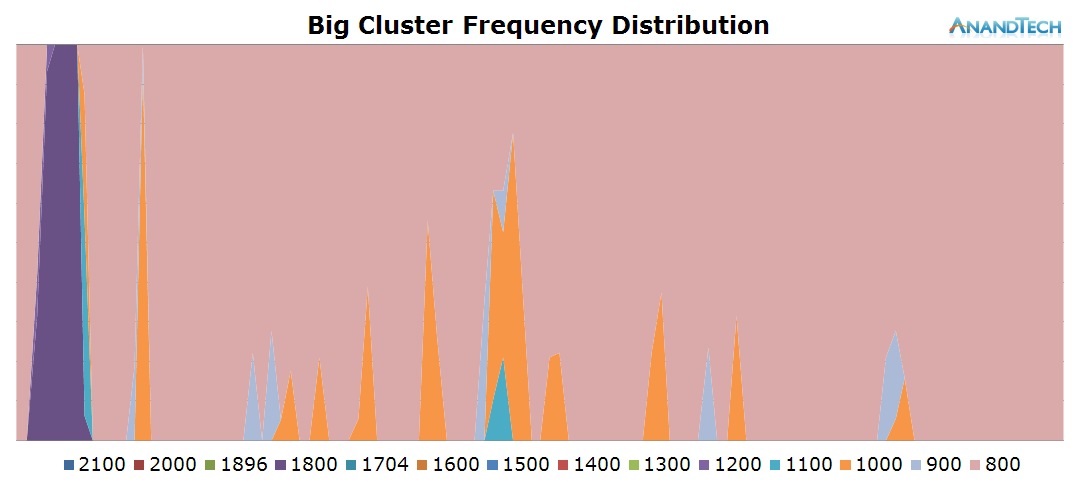
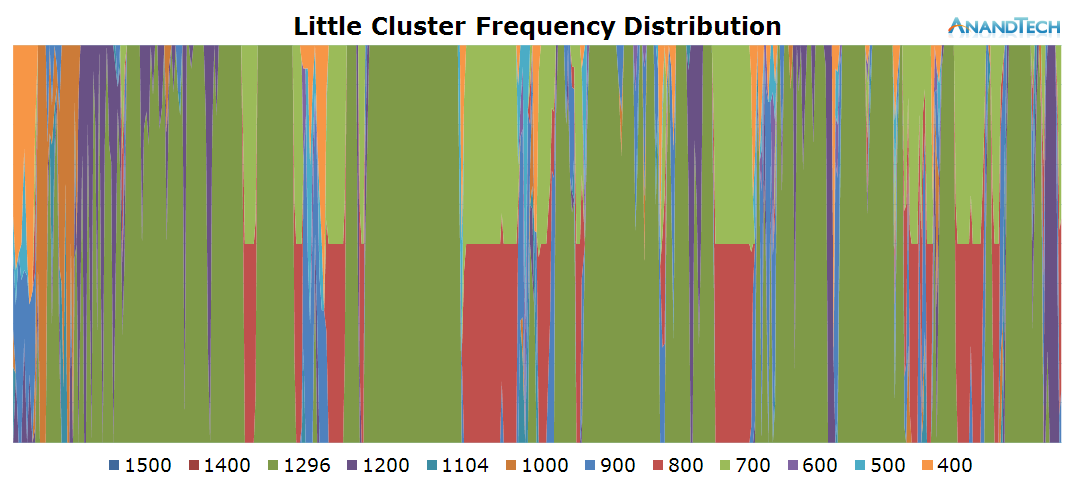
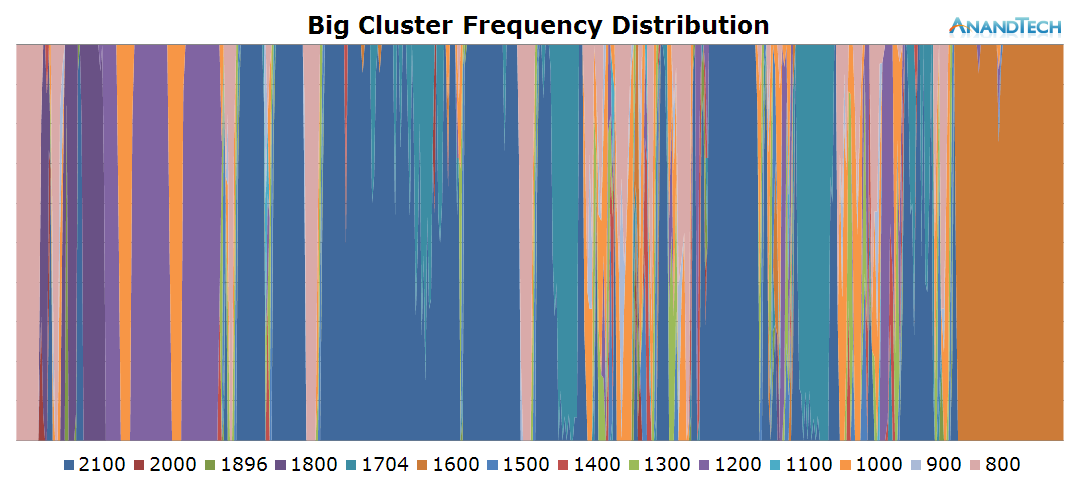
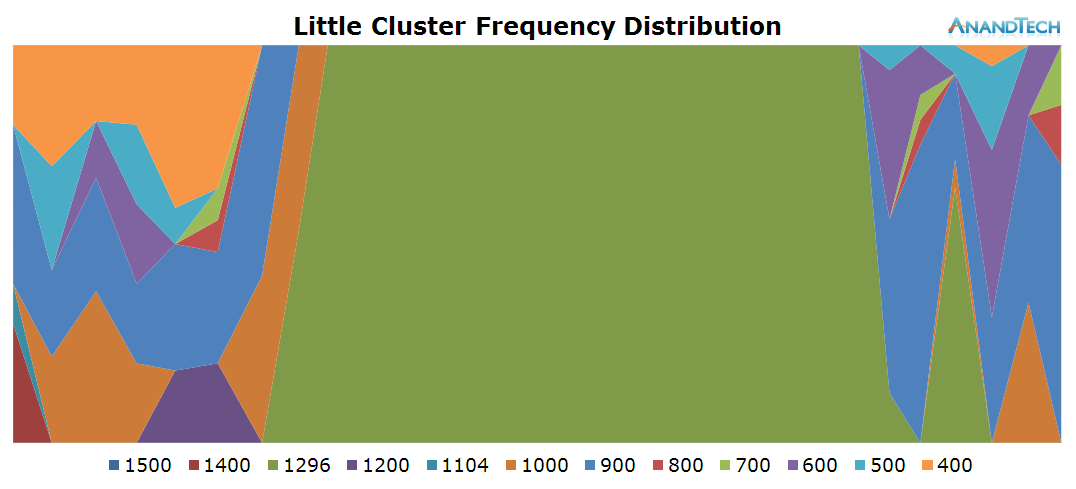
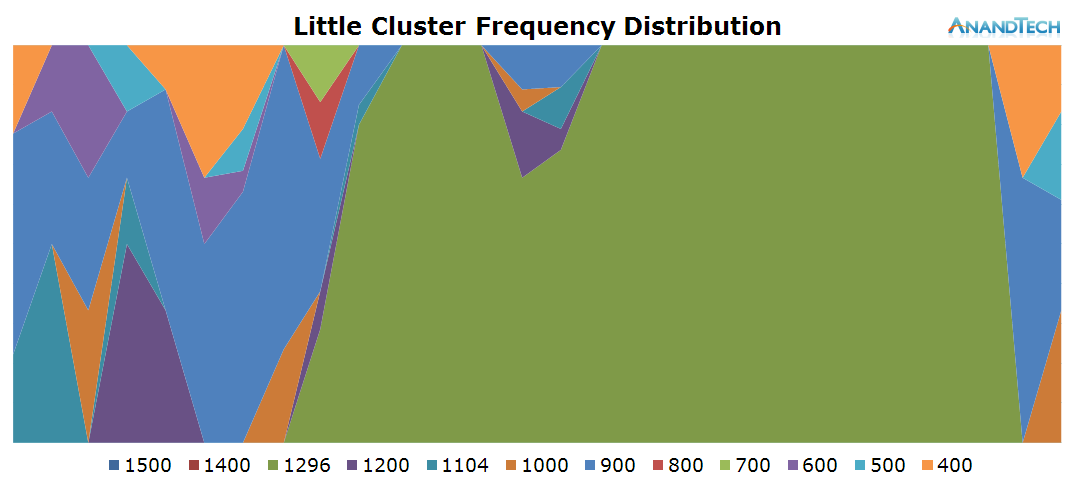
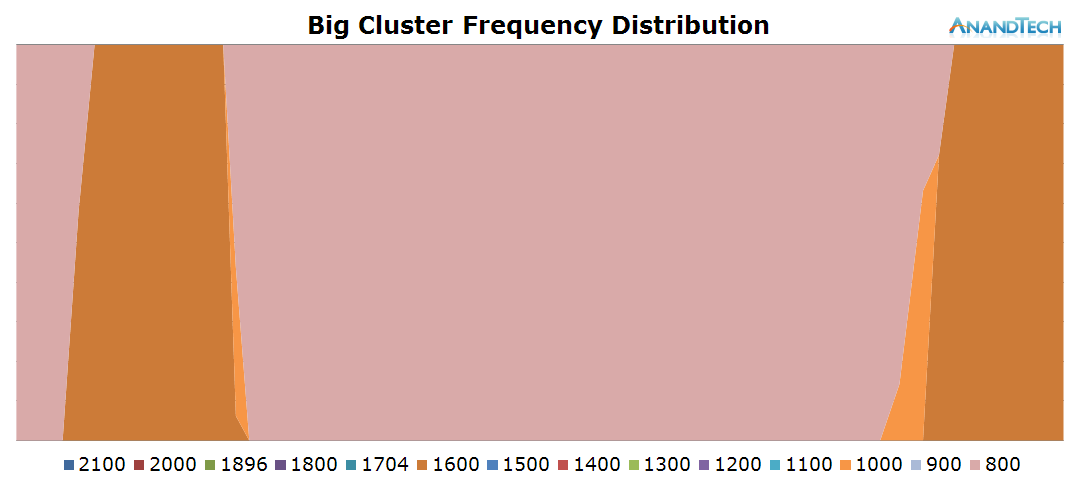
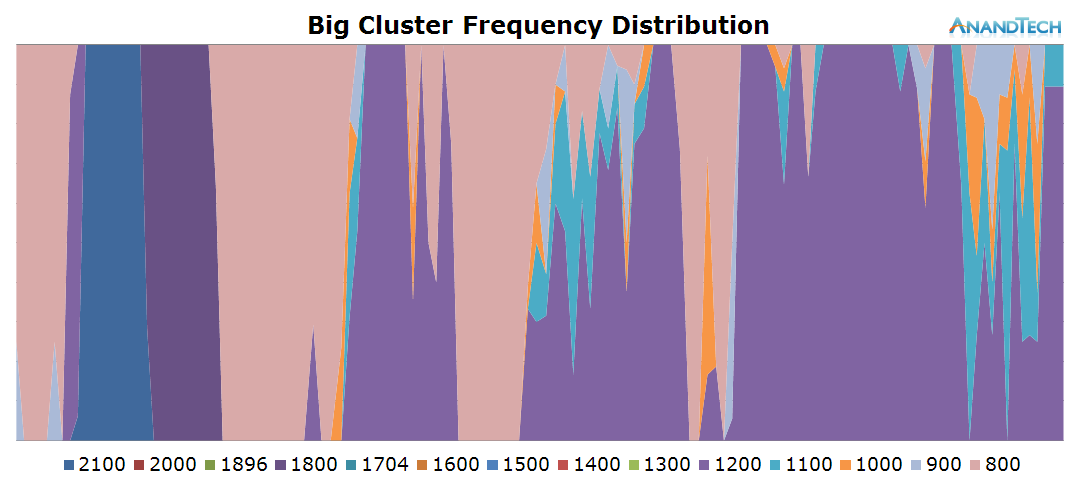
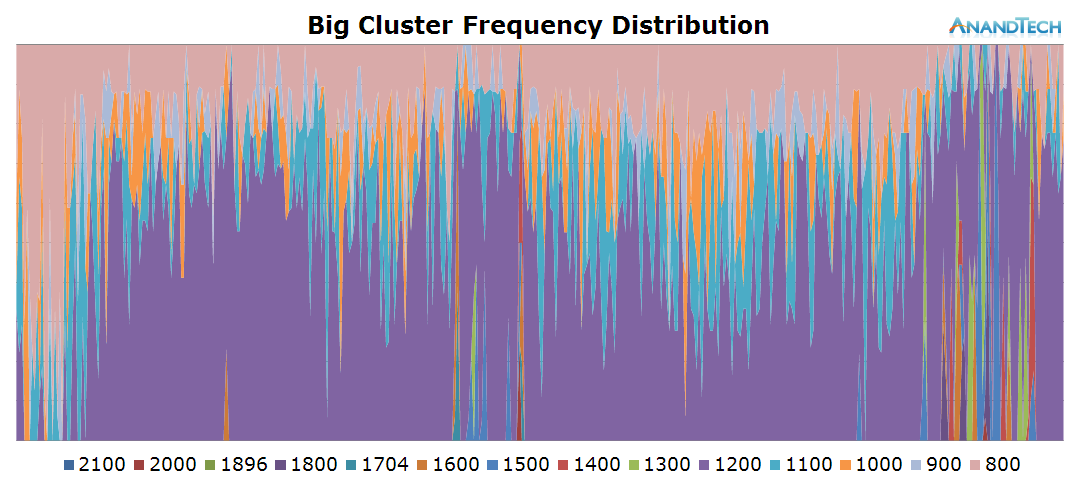
What we end up is a stacked time distribution graph such as this:
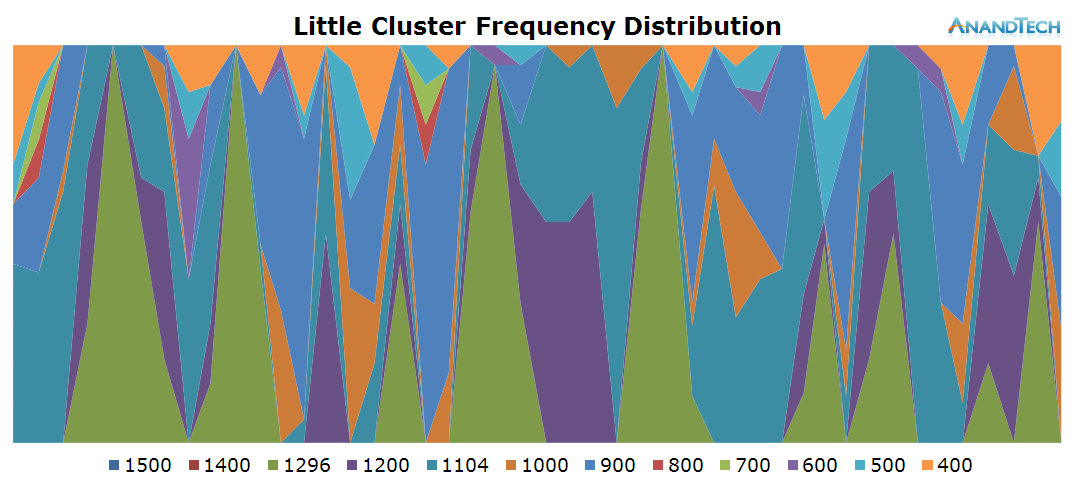
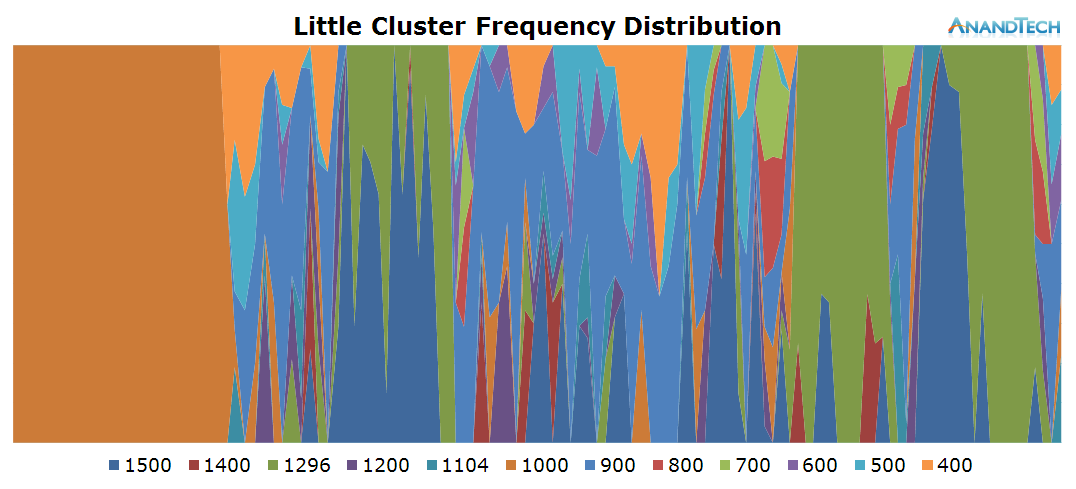
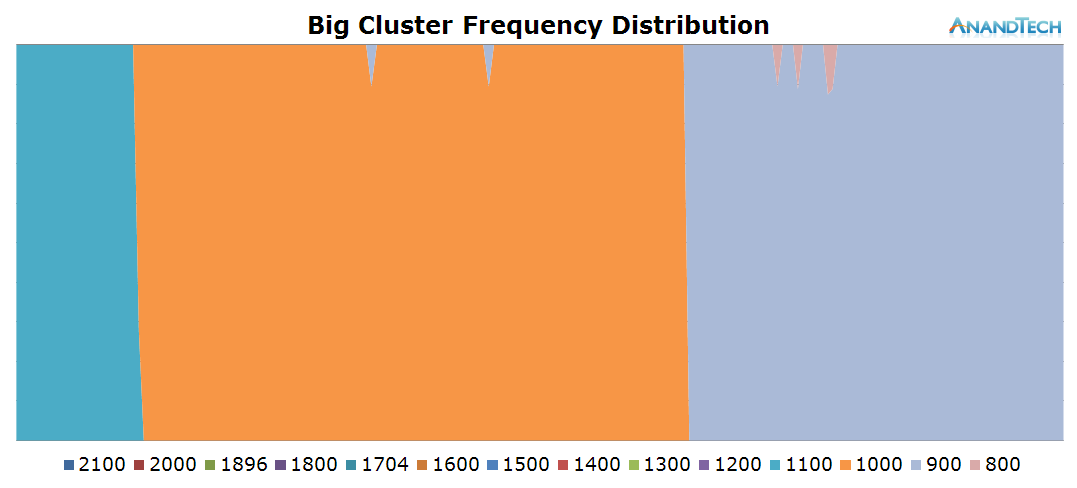
The Y-axis of the graph is a stacked percentage of each CPU’s frequency state. The X-axis represents the distribution in time, always depending on the scenario’s length. For readability’s sake in this article, I chose an effective ~200ms sample period (Due to overhead on scripting and time-keeping mechanisms, this is just a rough target) which should give enough resolution for a good graphical representation of the CPU’s frequency behaviour.
With this, we now have the first part of our tools to accurately analyse the SoC’s behaviour: frequency.
The Details: Power States
While frequency is one of the first metrics that comes to mind when trying to monitor a CPU’s behaviour, there’s a whole other hidden layer that rarely gets exposure: CPU idle states. For readers looking for a more in-depth explanation of how CPUIdle works, I’ve touched upon it and power management of modern SoCs in general work in our deep dive of the Exynos 7420. These explanations are valid for basically all of today's SoCs based on ARM CPU IP, so it applies to SoCs from MediaTek and ARM-based Qualcomm chipsets as well.
To keep things short, a simplified explanation is that beyond frequency, modern CPUs are able to save power by entering idle states that either turn off the clock or the power to the individual CPU cores. At this point we’re talking about switching times of ~500µs to +5ms. It is rare to find SoC vendors expose APIs for live readout of the power states of the CPUs, so this is a statistic one couldn’t even realistically log via discrete readouts. Luckily CPU idle states are still arbitrated by the kernel, which again, similarly to the CPUFreq framework, provides us aggregate time-in-state statistics for each power state on each CPU.
This is an important distinction to make in today’s ARM CPU cores as (except for Qualcomm’s Krait architecture) all CPUs within a cluster run on the same synchronous frequency plane. So while one CPU can be reported to be running at a high frequency, this doesn’t really tell us what it’s doing and could as well be fully power-gated while sitting idle.
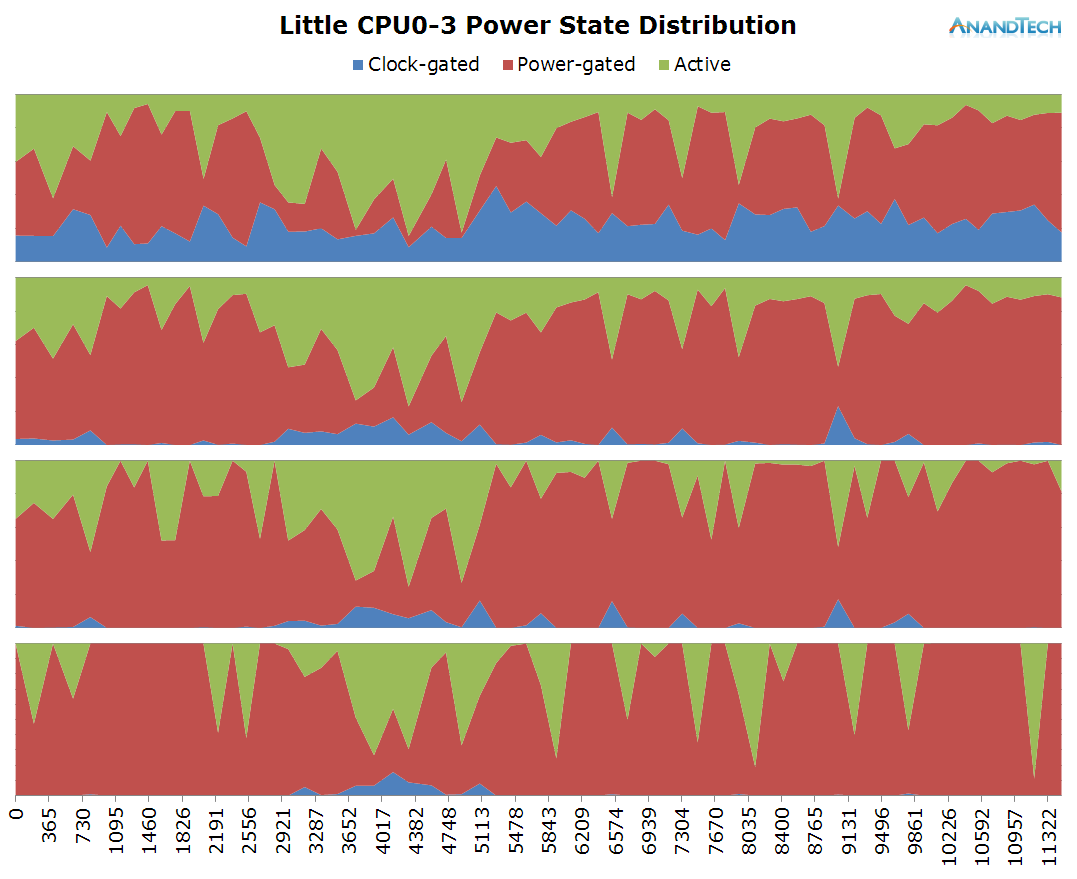
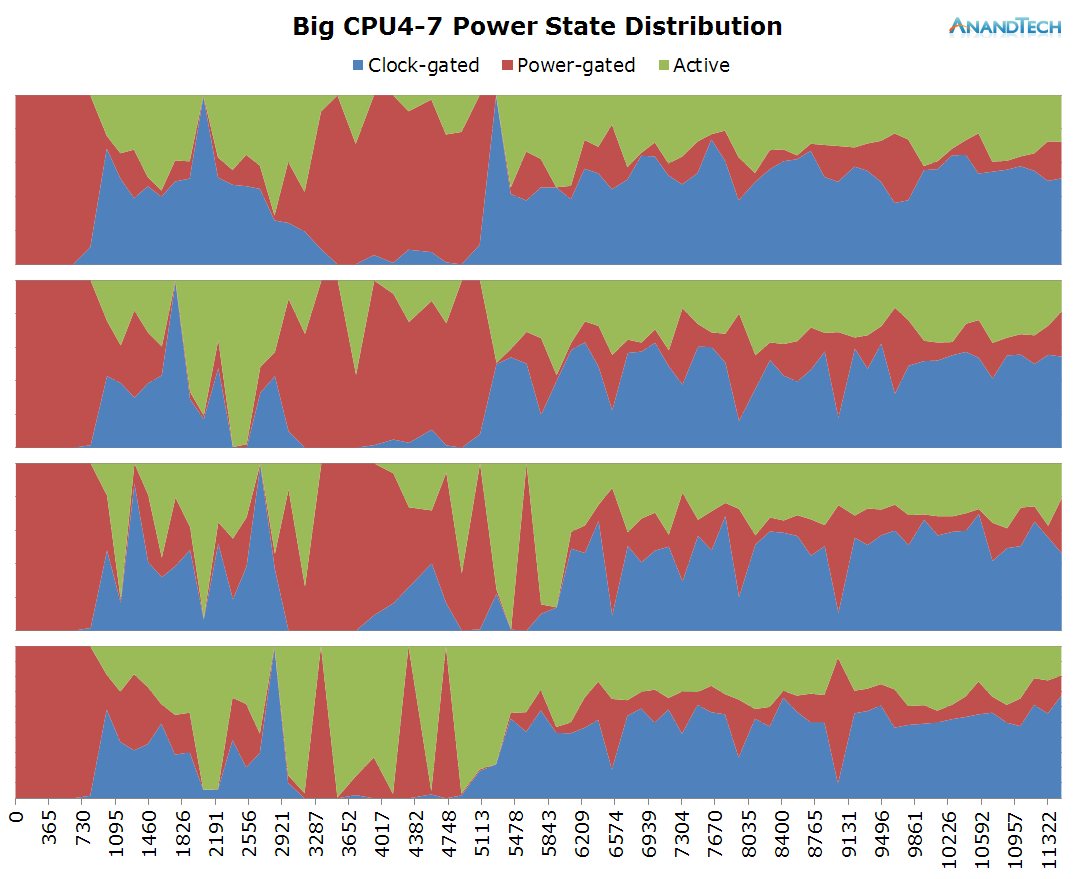
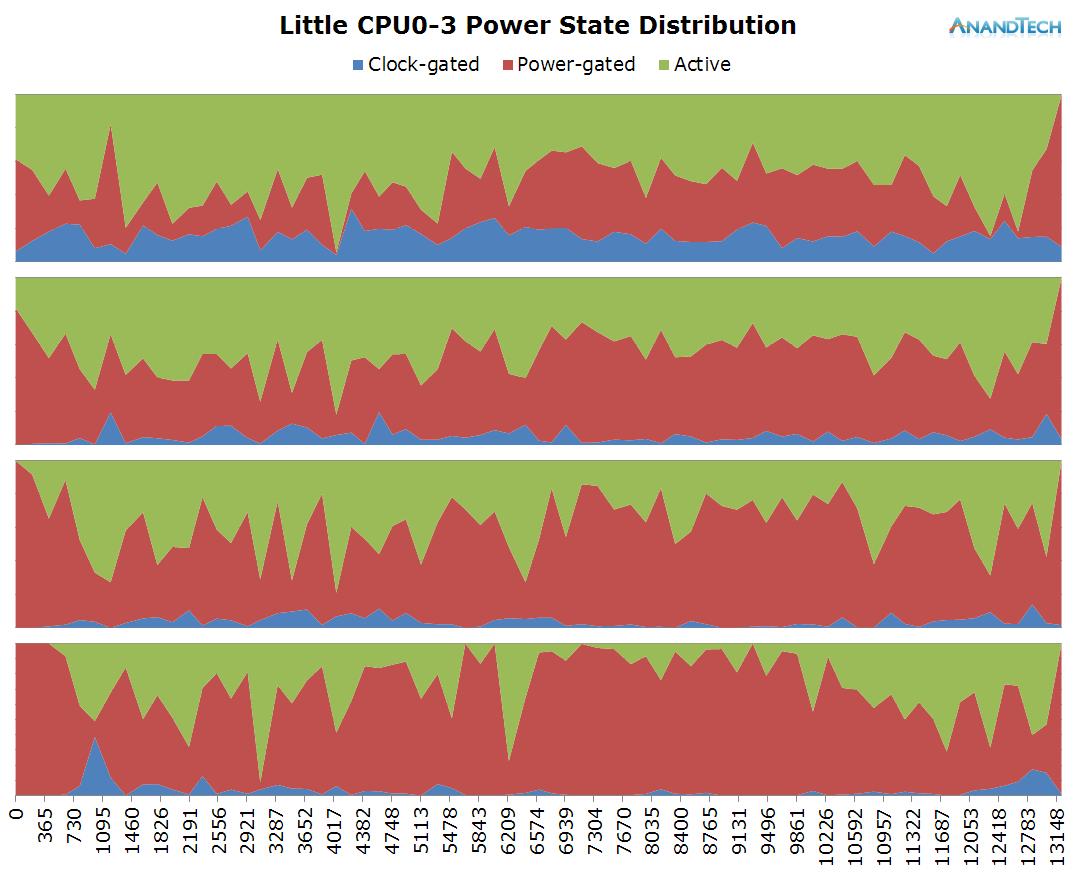
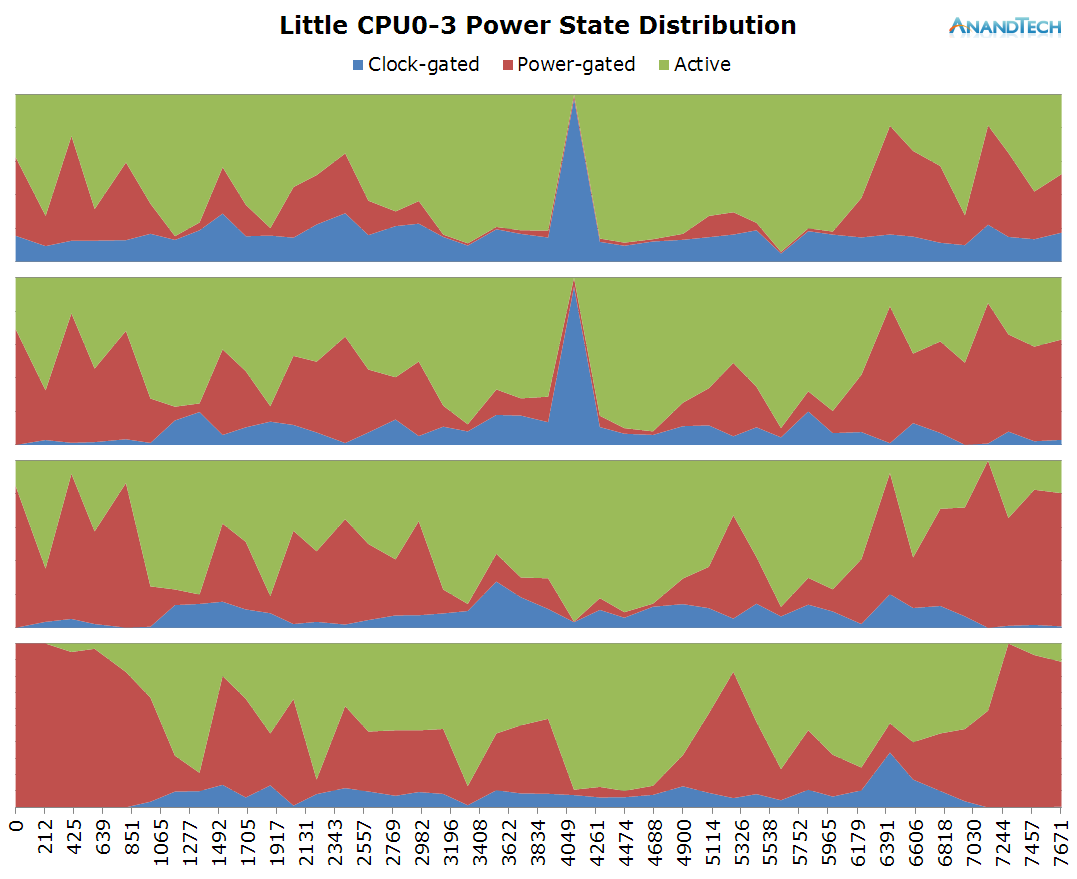
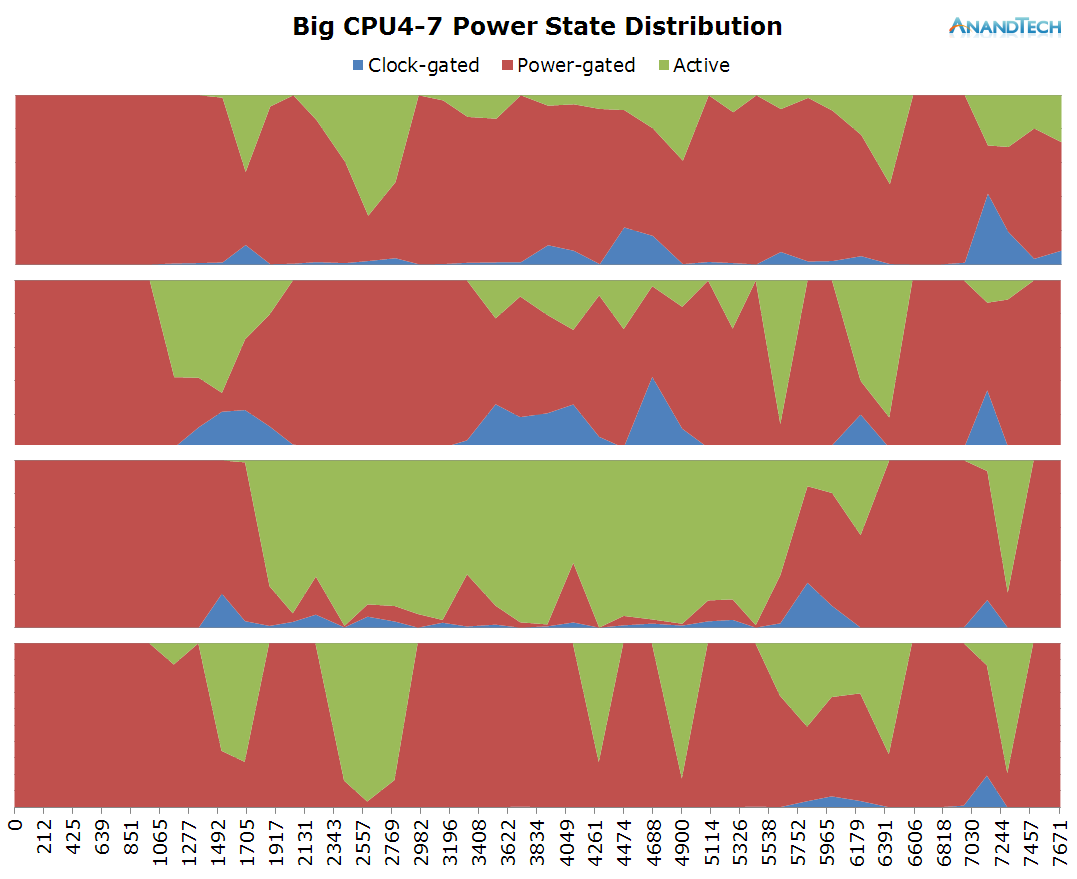
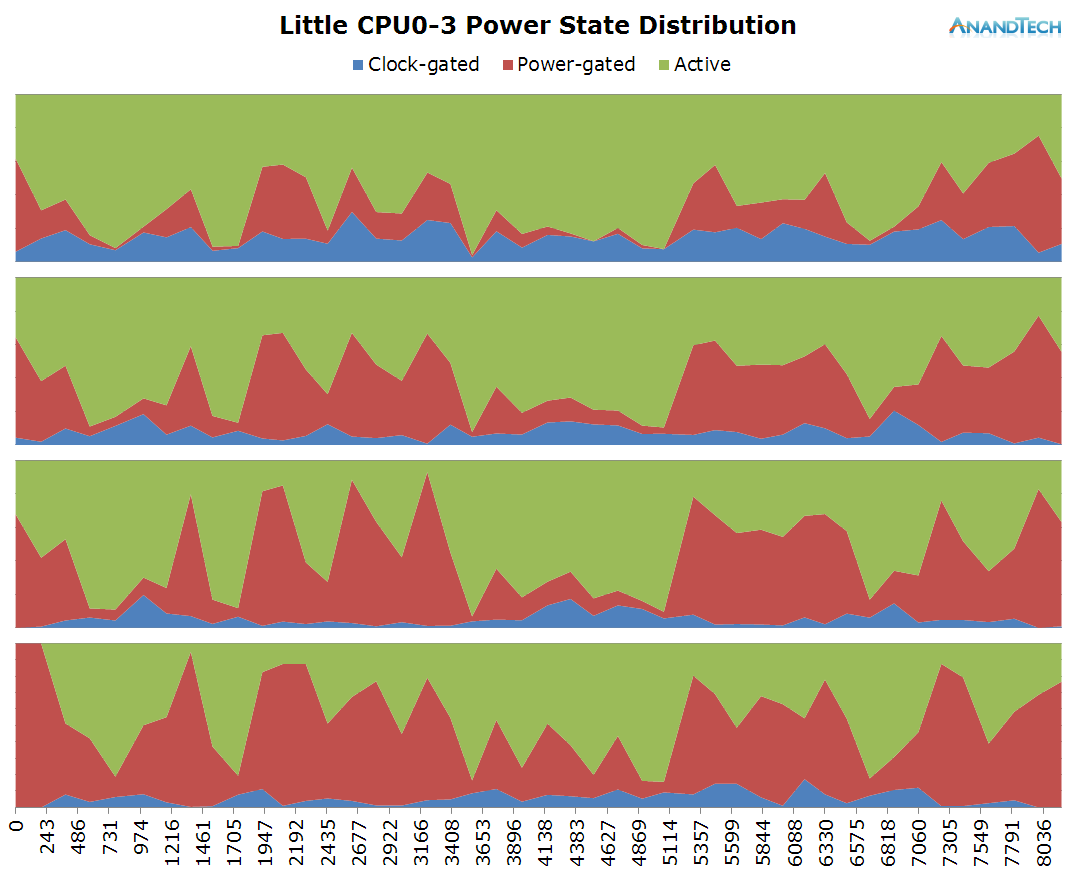
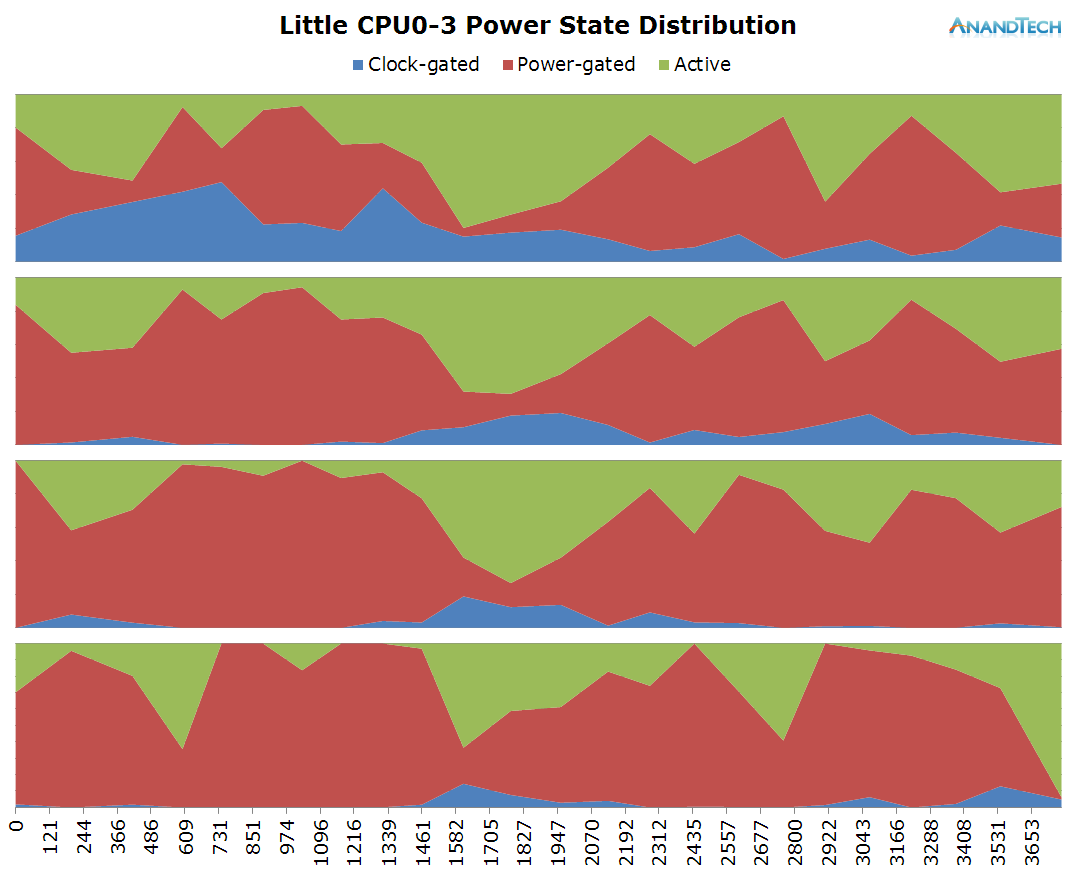
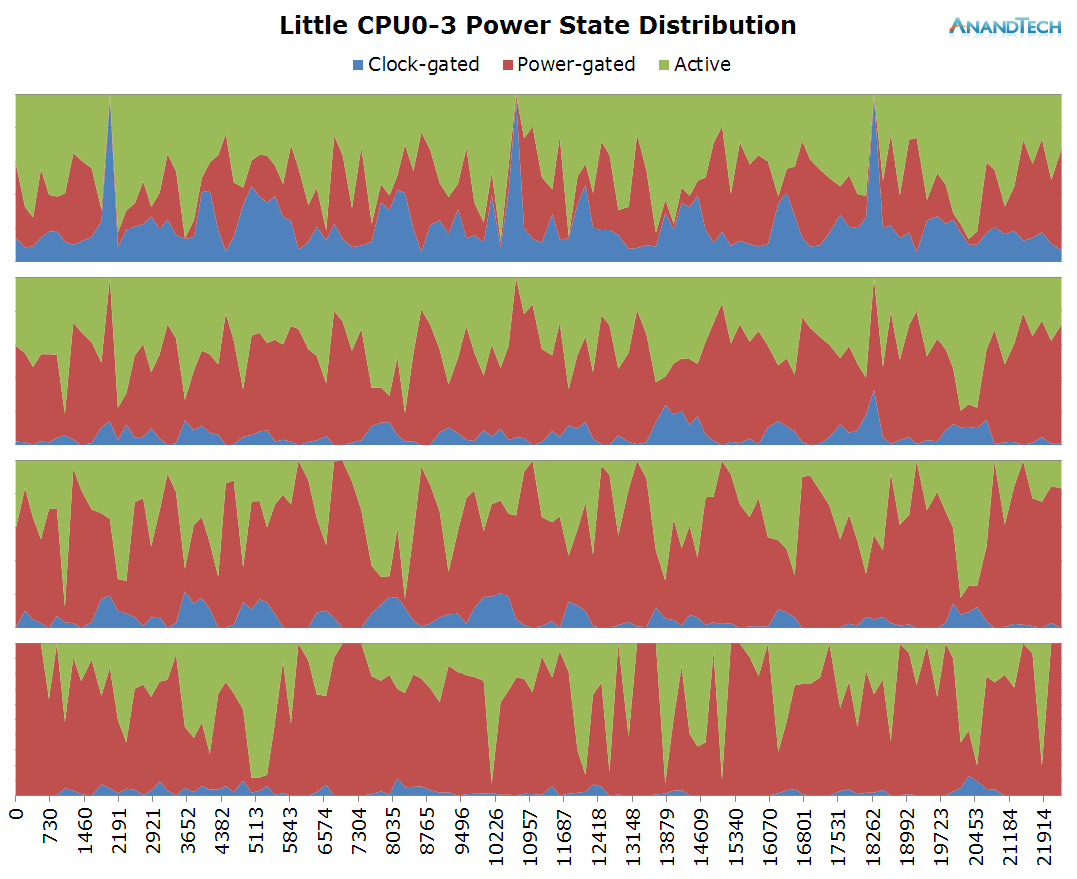
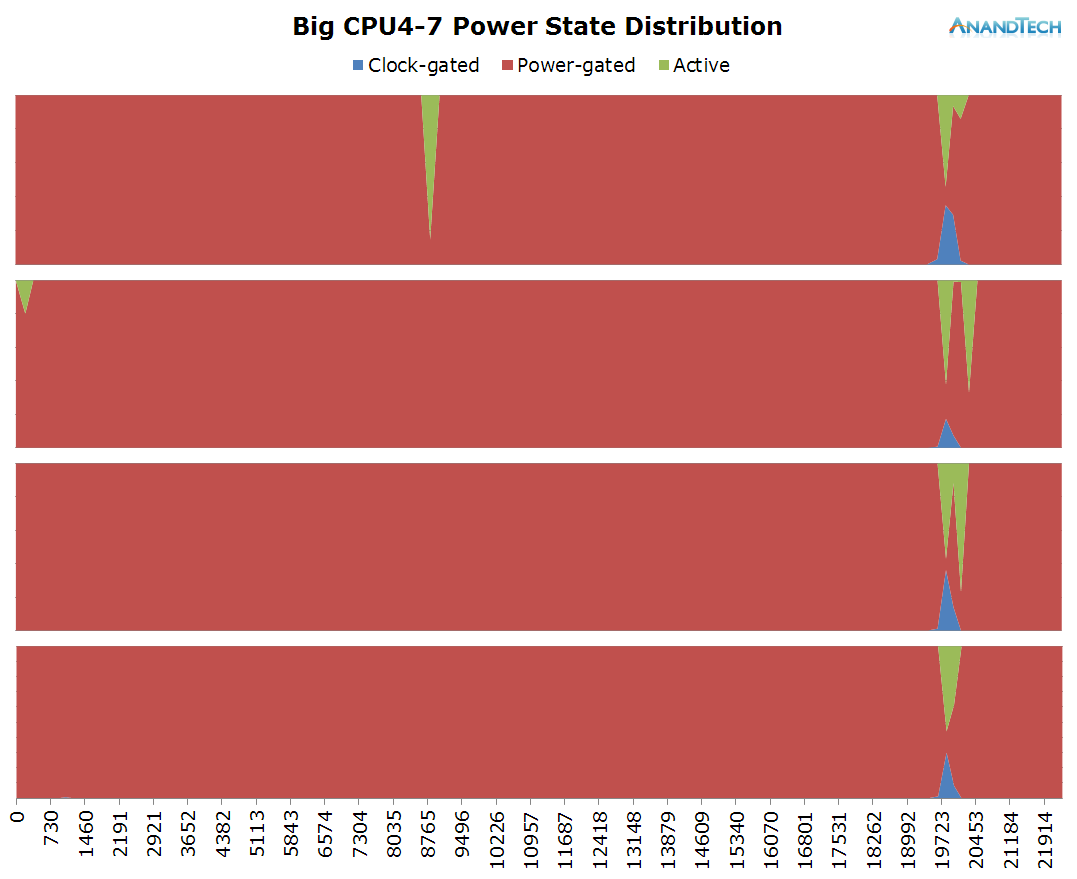
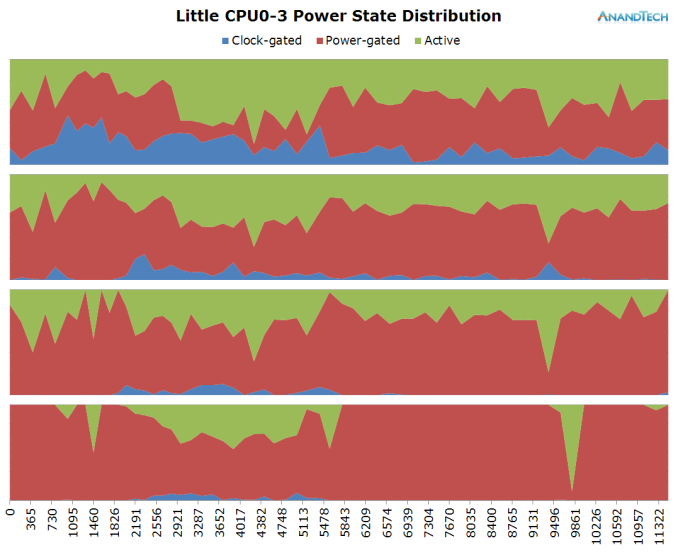
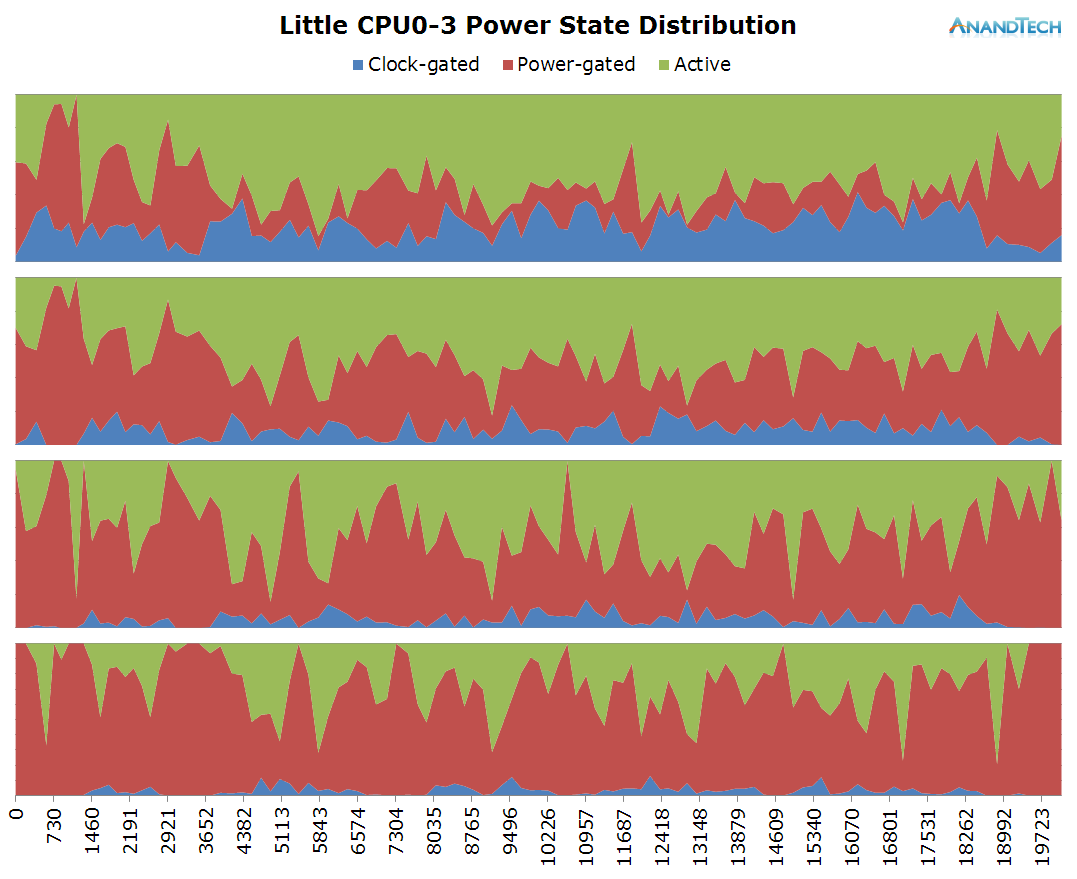
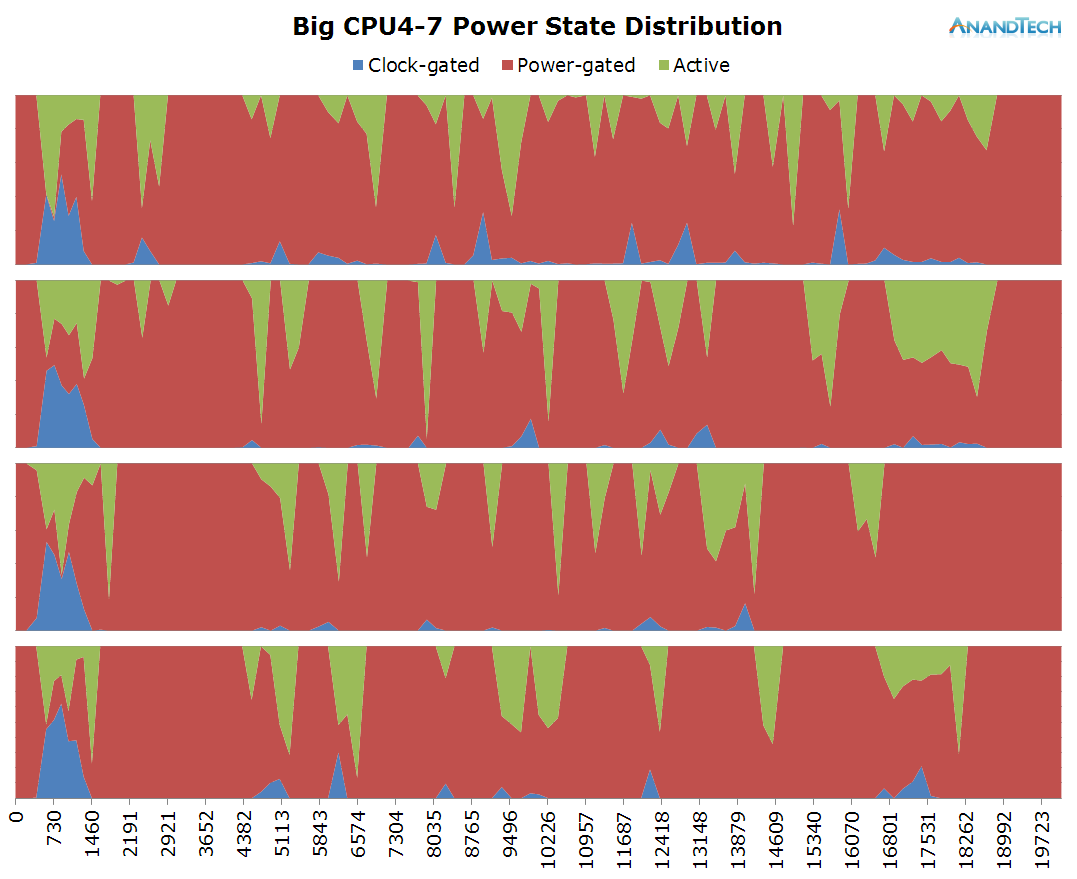
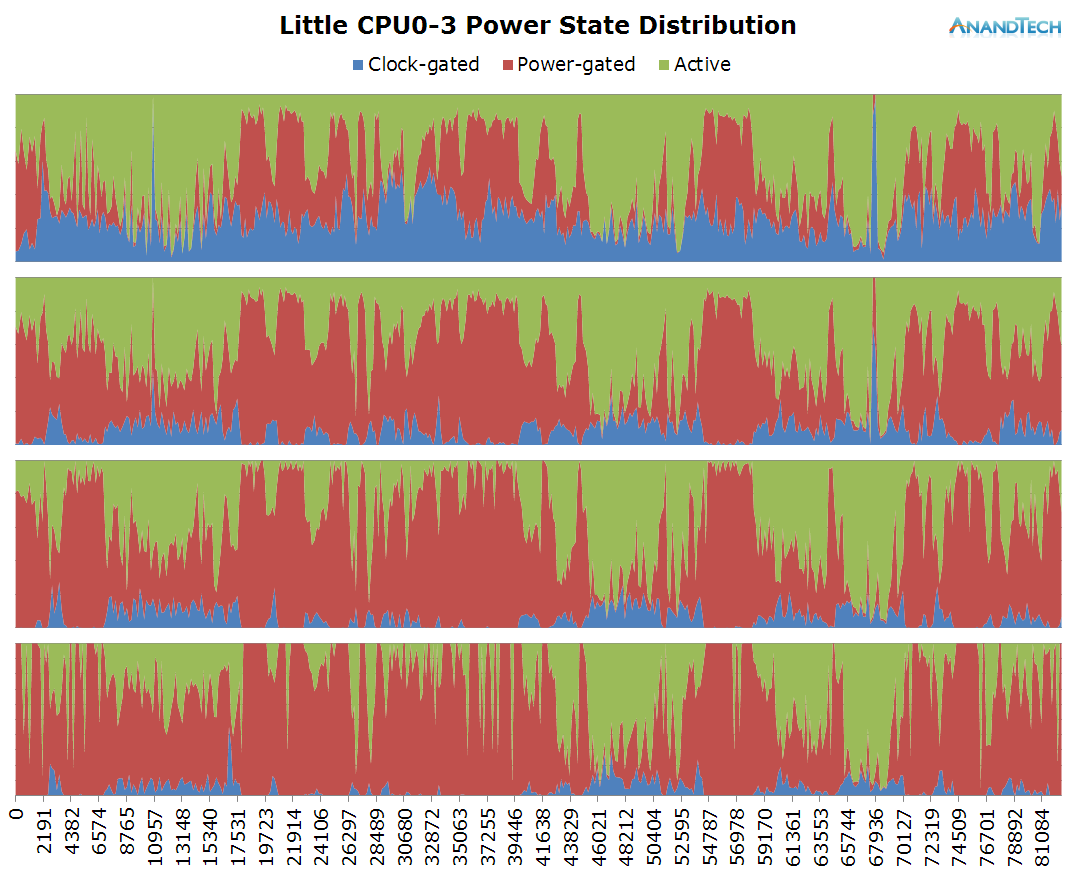
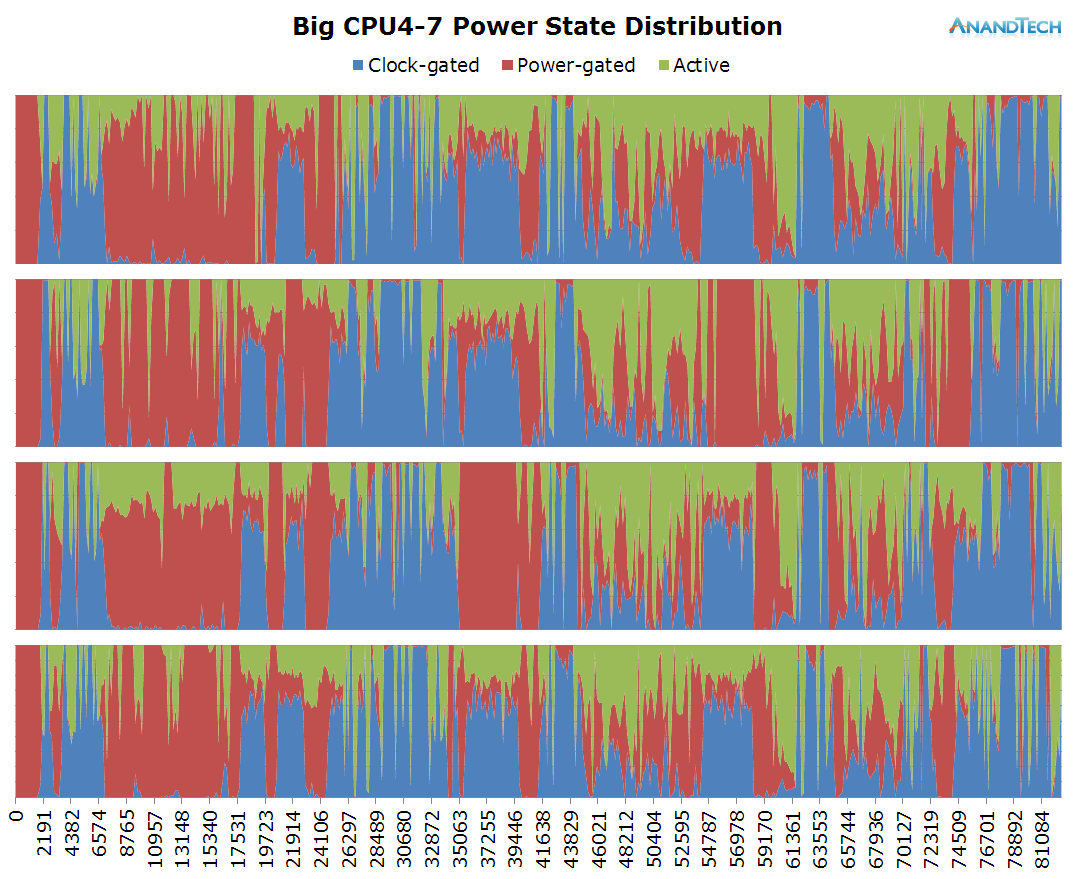
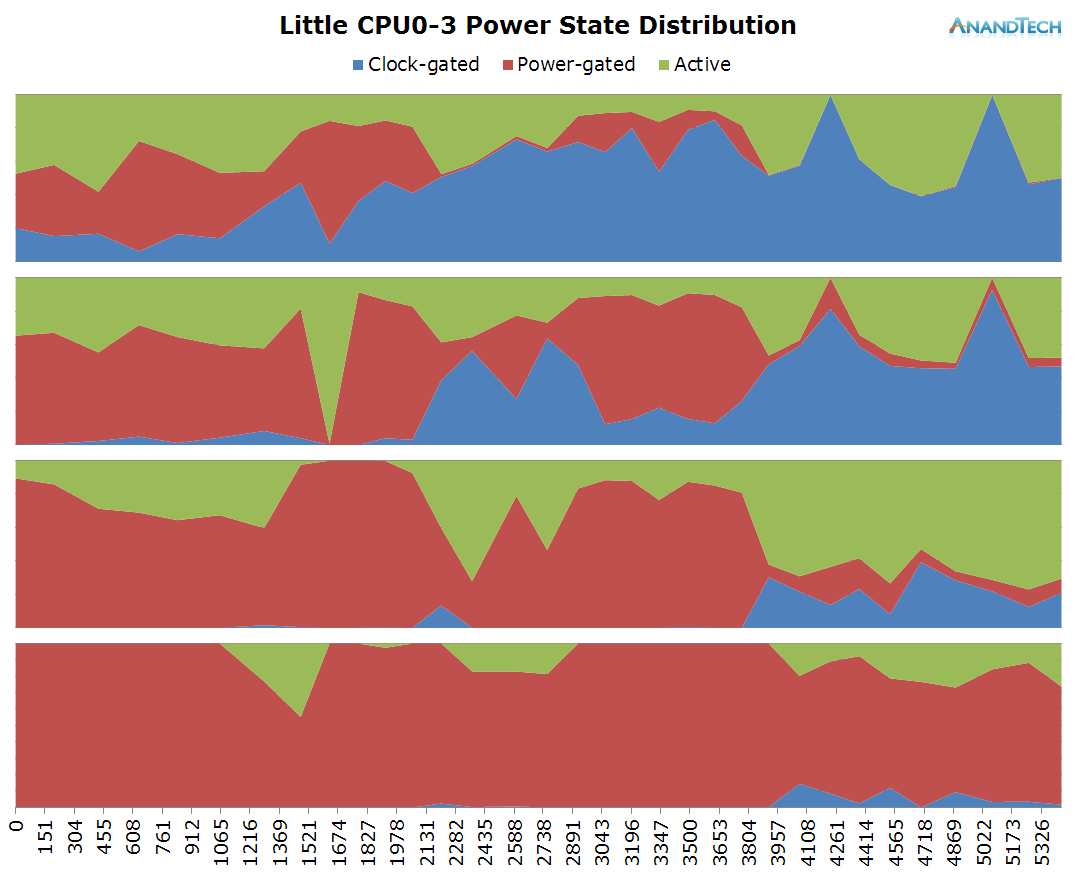
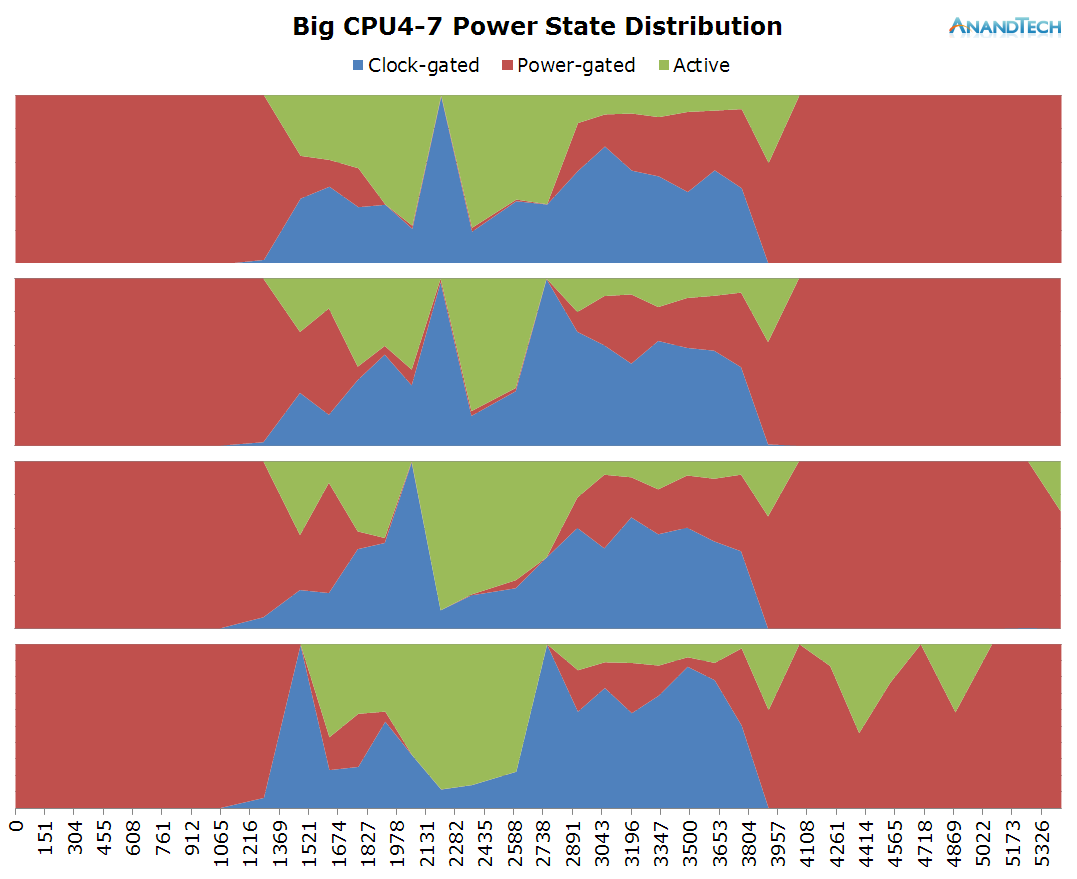
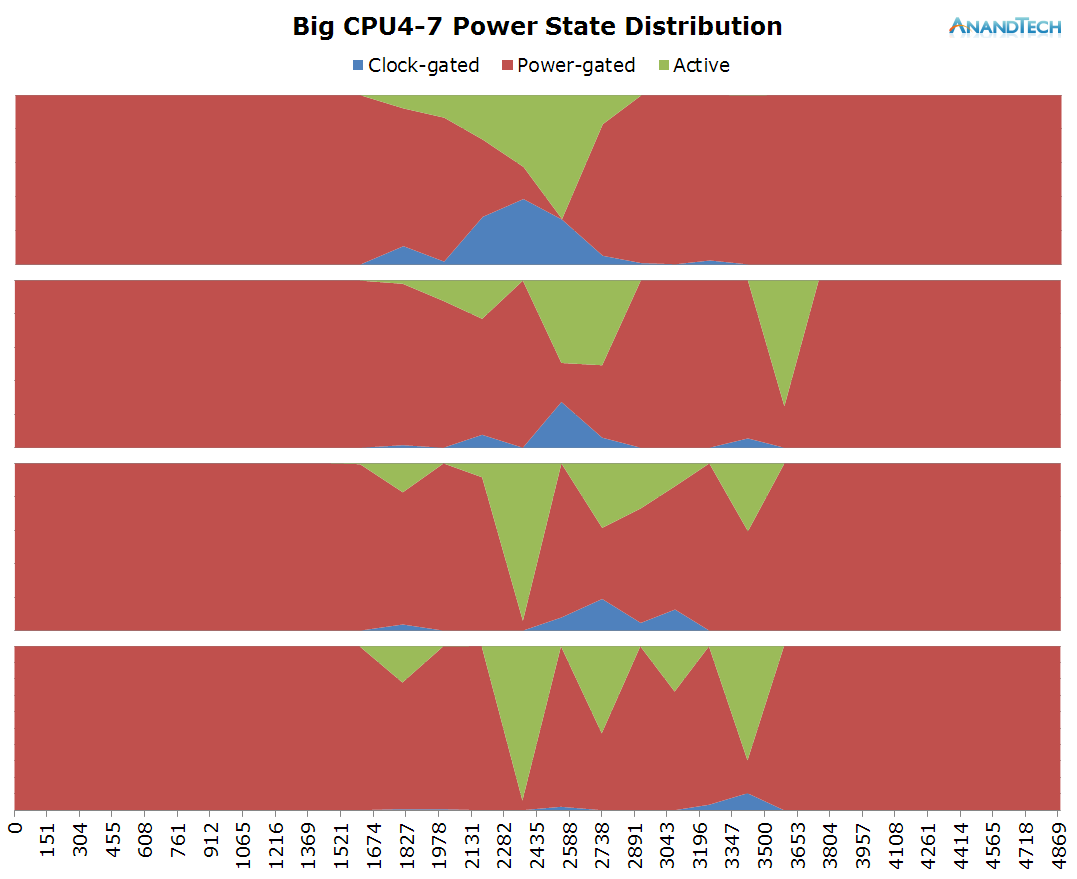
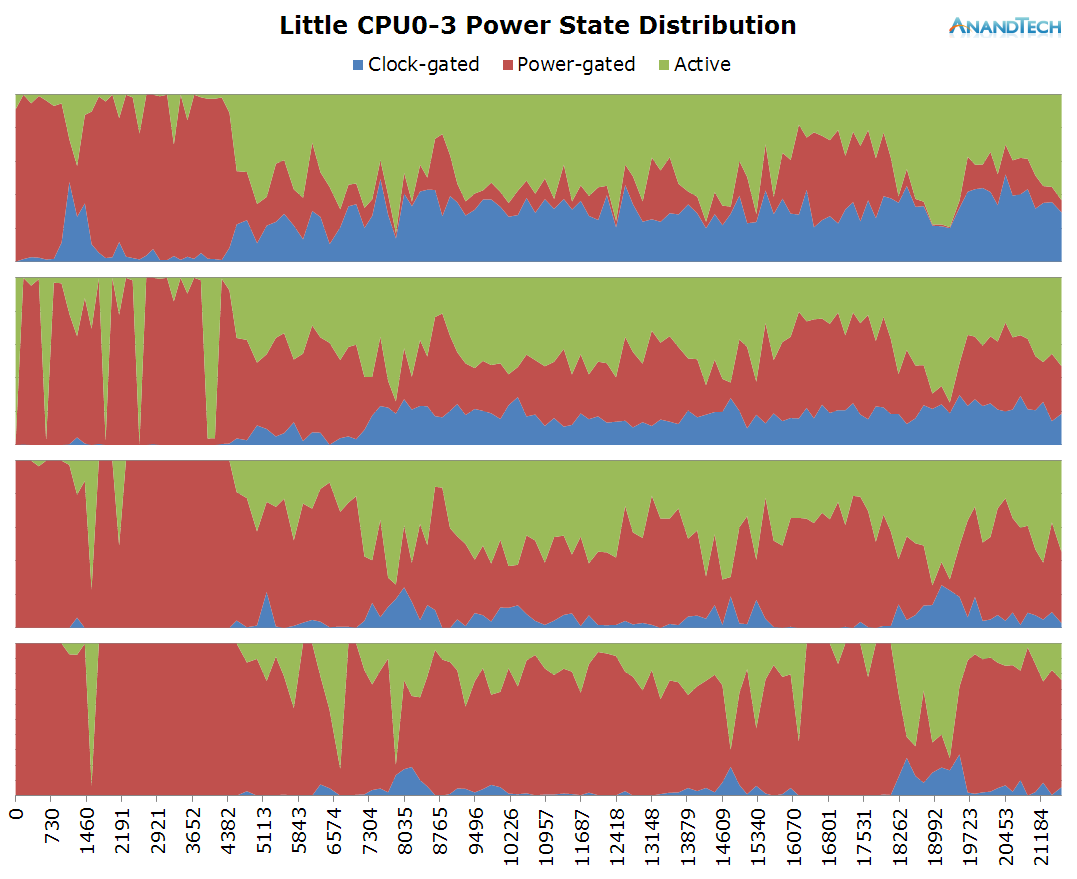
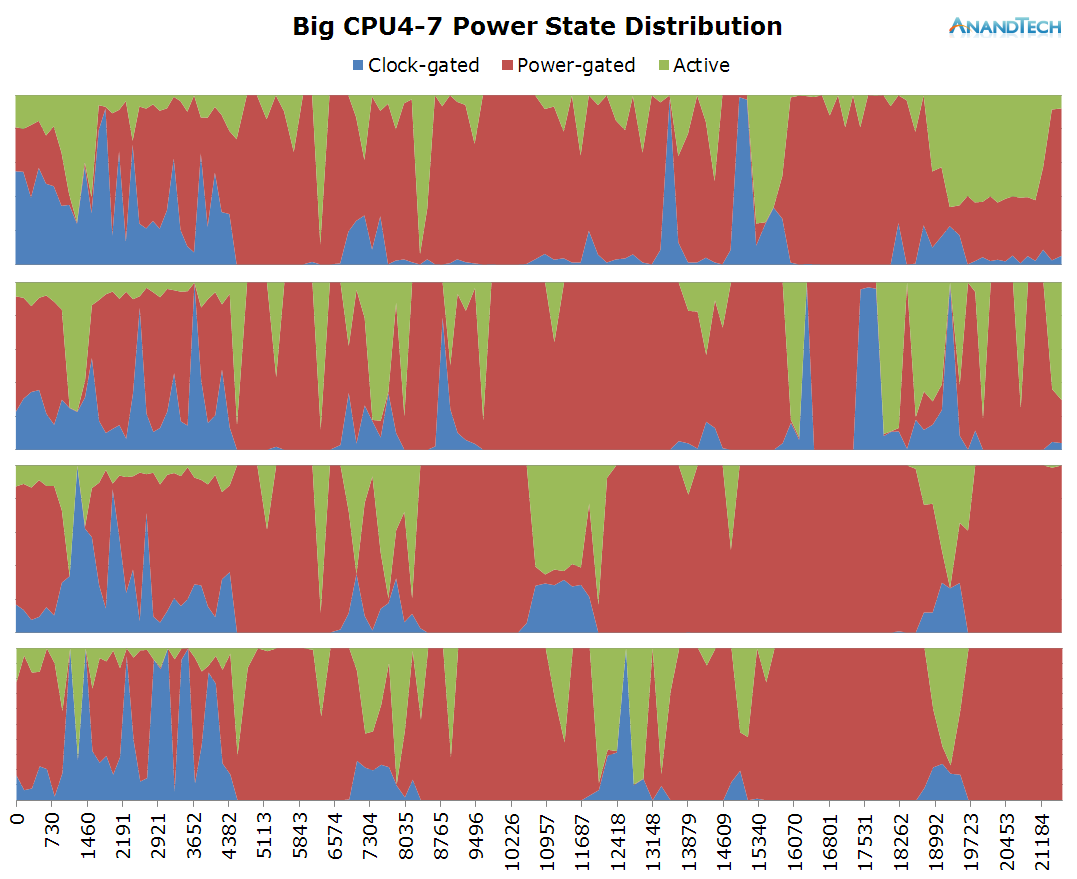
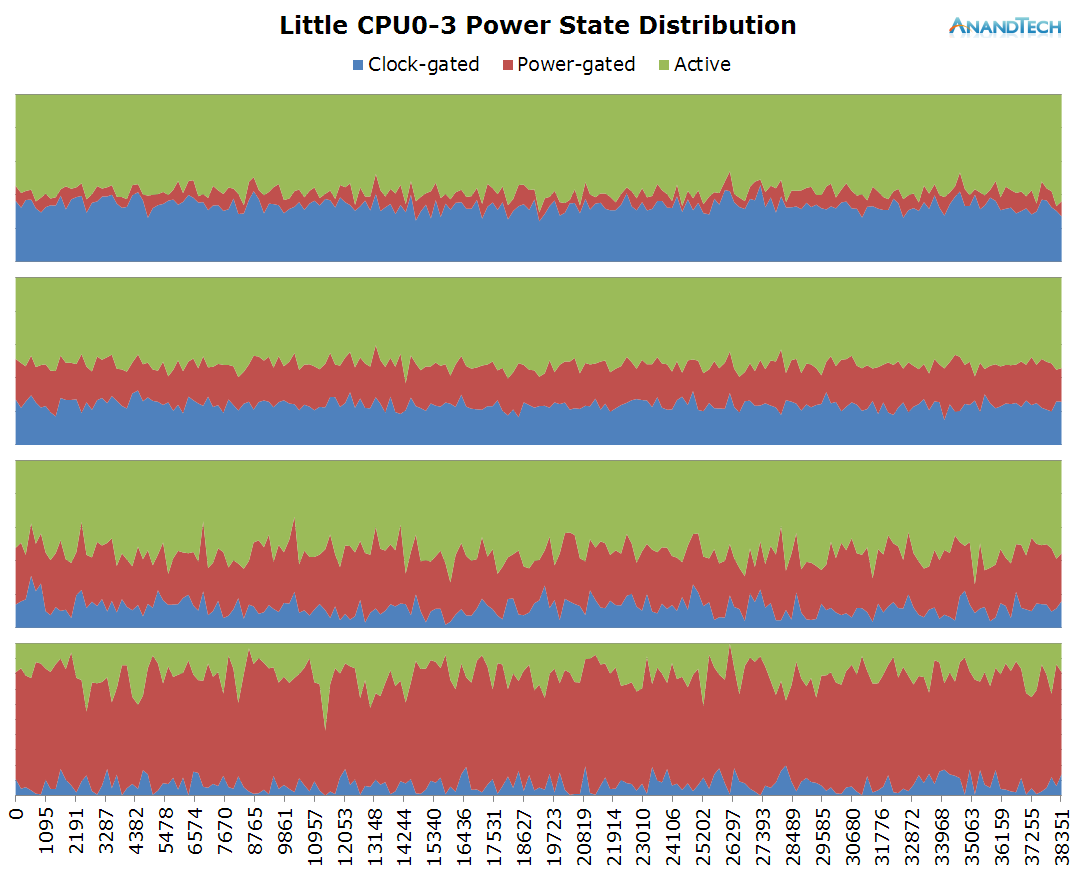
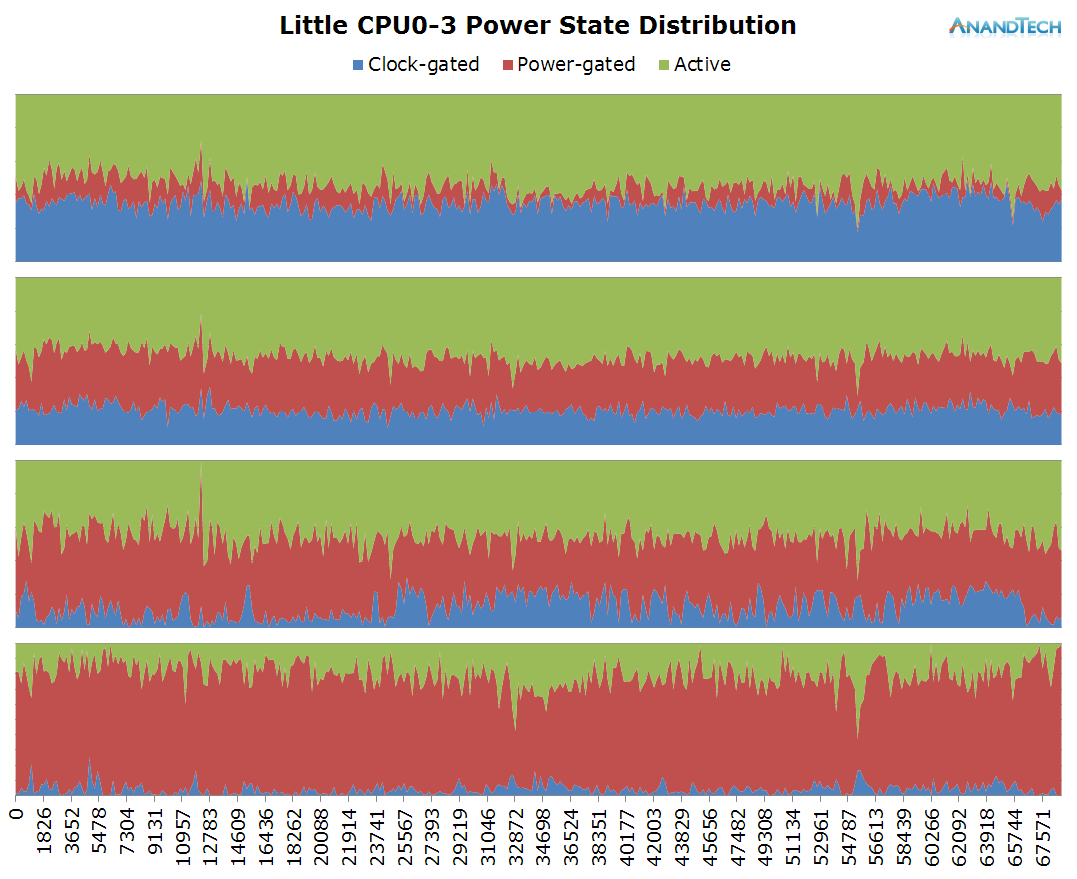
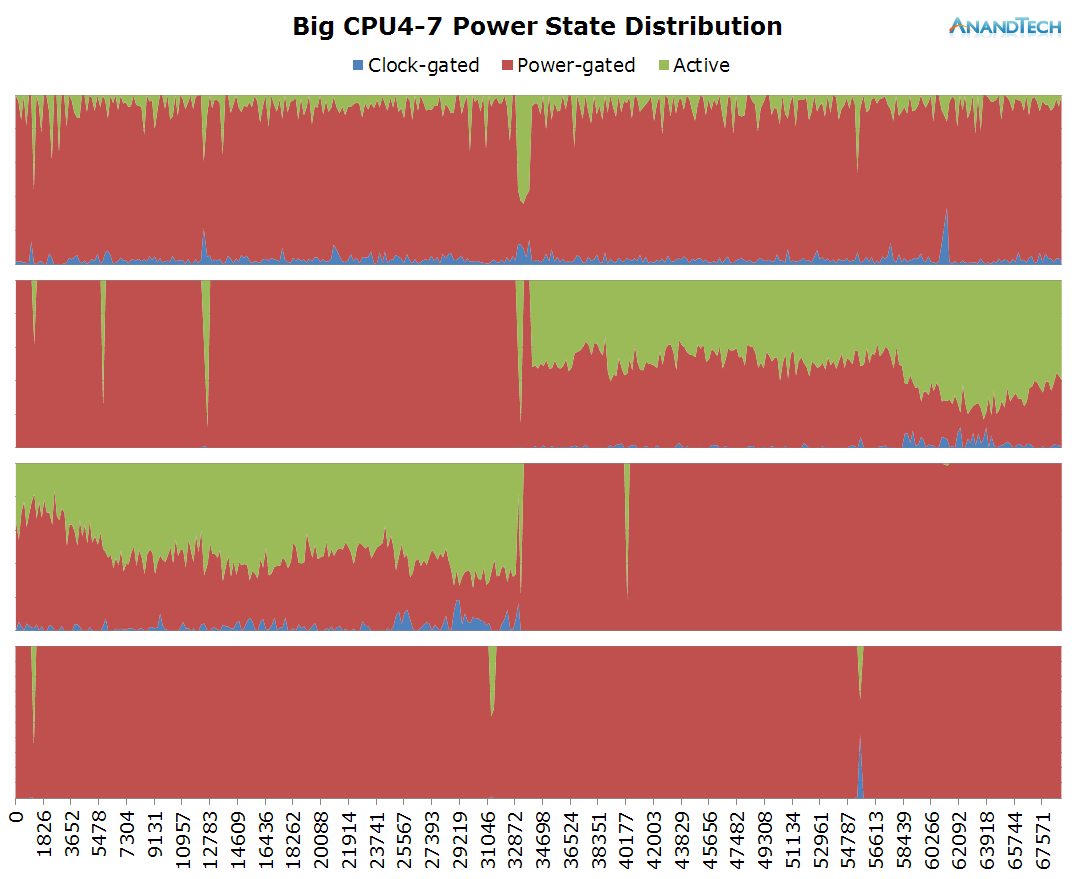
Using the same method as for frequency logging, we end up with an idle power-state stacked time-distribution graph for all cores within a cluster. I’ve labelled the states as “Clock-gated”, “Power-gated” and “Active” which in technical terms they represent the WFI (Wait-For-Interrupt) C1, power-collapse C2 idle states, as well as the difference in time to the wall-clock which represents the “active” time in which the CPU isn’t in any power-saving state.
The Intricacies: Scheduler Run-Queue Depths
One metric I don’t think that was ever discussed in the context of mobile is the depth of the CPU’s run-queue. In the Linux kernel scheduler the run-queue is a list of processes (The actual implementation involves a red-black tree) currently residing on that CPU. This is at the core of the preemptive scheduling nature of the CFS (Completely Fair Scheduler) process scheduler in the Linux kernel. When multiple processes run on the same CPU the scheduler is in charge to fairly distribute processing time between each thread based on time-slices and process priority.
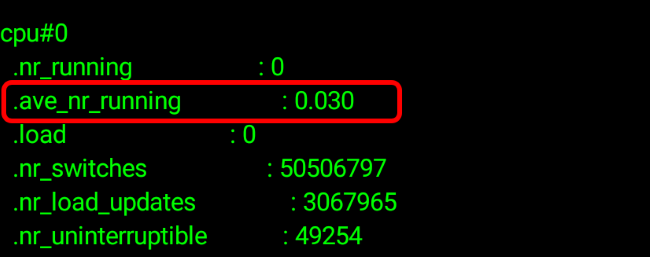
The kernel and Android are able to sort of expose information on the run-queue through one of the kernel’s sysfs nodes. On Android this can be enabled through the “Show CPU Usage” option in the developer options. This gives you three numerical parameters as well as a list of the read-out active processes. The numerical value is the so-called “load average” of the scheduler. It represents the load of the whole system – and it can be used to read how many threads in a system are used. The three values represent averages for different time-windows: 1 minute, 5 minutes and 15 minutes. The actual value is a percentage – so for example 2.85 represents 285%. How this is meant to be interpreted is that if we were to consolidate all processes in as little CPUs as possible we theoretically have two CPUs whose load is 100% (summing up to 200%) as well as a third up to 85% load.
Now this is very odd, how can the phone be fully using almost 3 cores while I was doing nothing more than idling on the screen with the CPU statistics on? Sadly the kernel scheduler suffers from the same sampling rate issue as explained in our frequency logging methodology. Truth is that the load average statistic is only a snapshot of the scheduler’s run-queues which is updated only in 5-second intervals and the represented value is a calculated load based on the time between snapshots. Unfortunately this statistic is extremely misleading and in no way represents the actual situation of the run-queues. On Qualcomm devices this statistic is even more misleading as it can show load-averages of up to 12 in idle situations. Ultimately, this means it’s basically impossible to get accurate RQ-depth statistics on stock devices.
Luckily, I stumbled upon the same issue a few years ago and was aware of a patch that I previously used in the past and which was authored by Nvidia which introduces detailed rq-depth statistics. This tracks the run-queues accurately and atomically each time a process enters or leaves a run-queue, enabling it to expose a sliding-window average of the run-queue depth of each CPU over the period of 134ms.
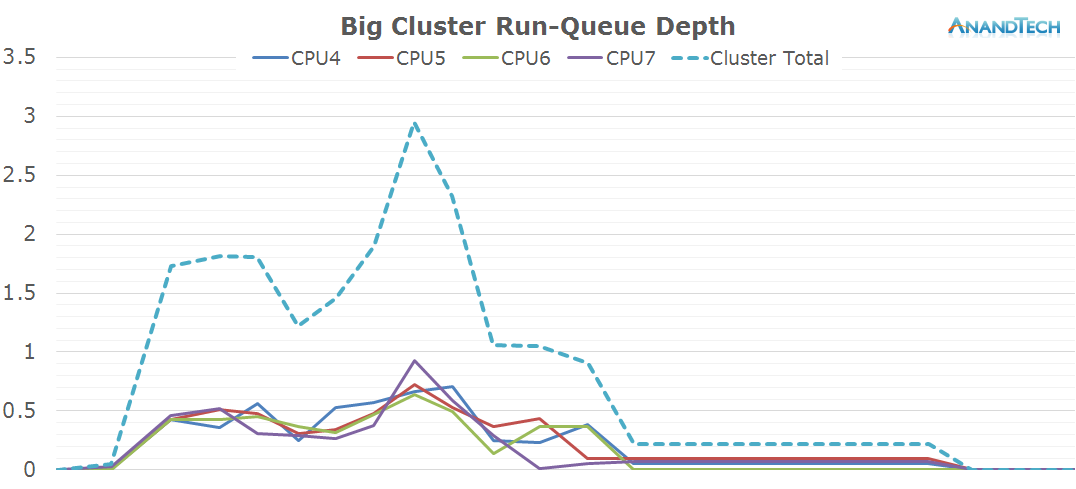
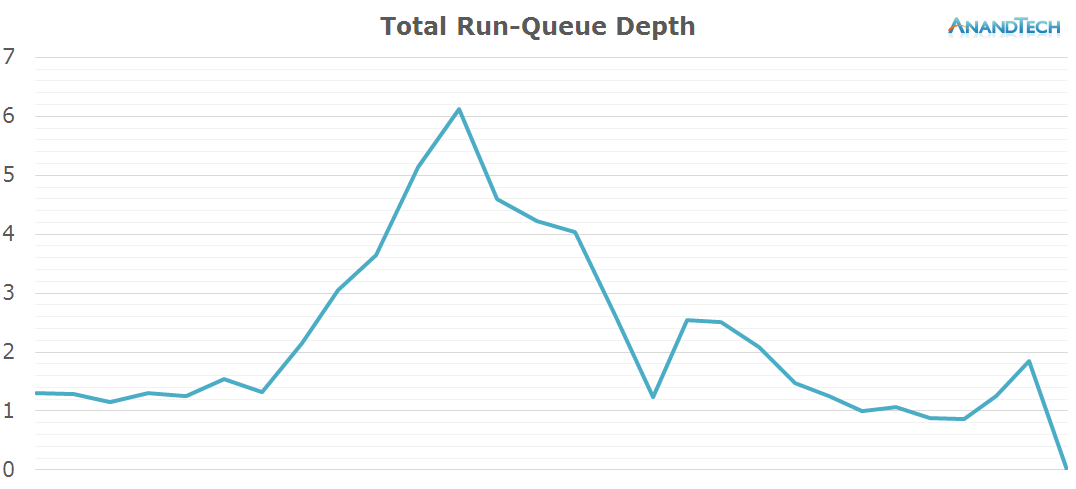
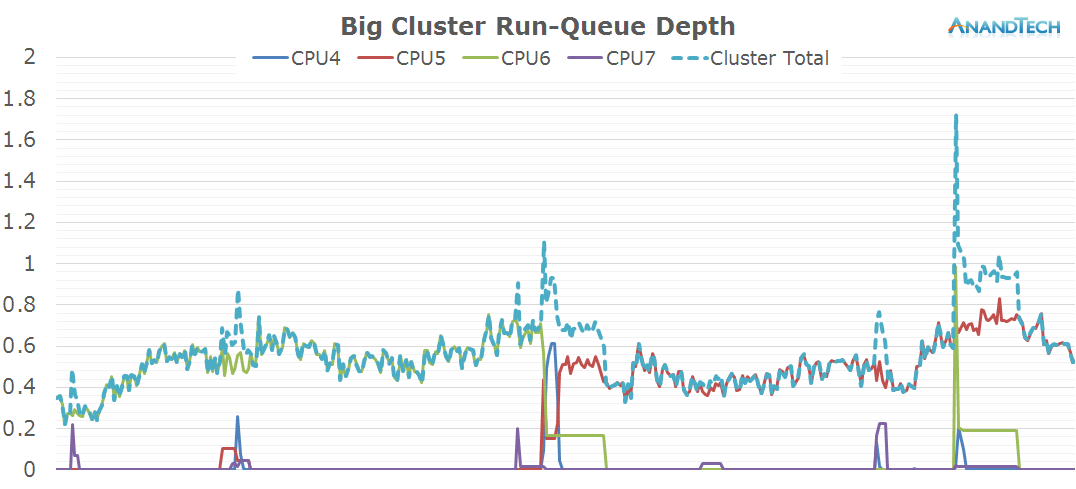
Now we have a live pollable average for the scheduler’s run-queues and we can fully log the exact amount of threads run on the system.
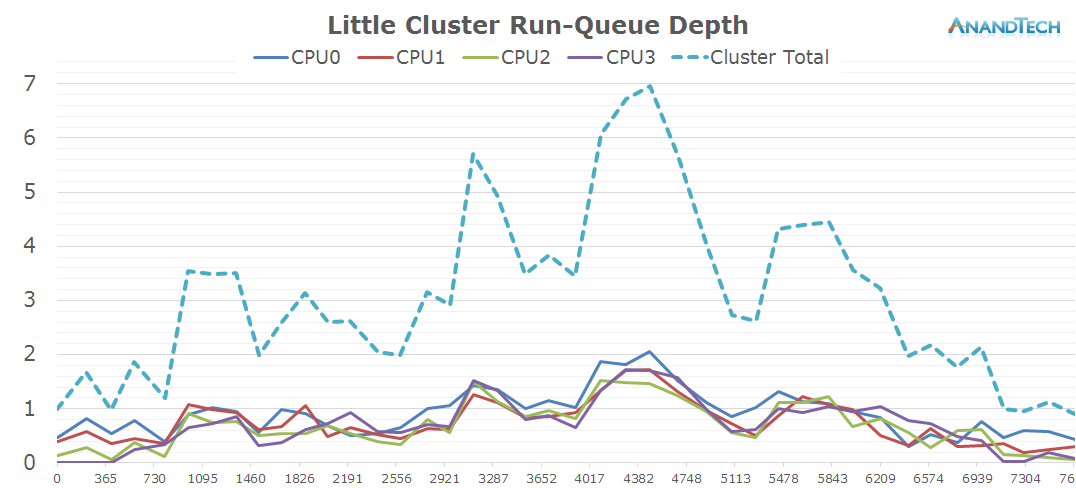
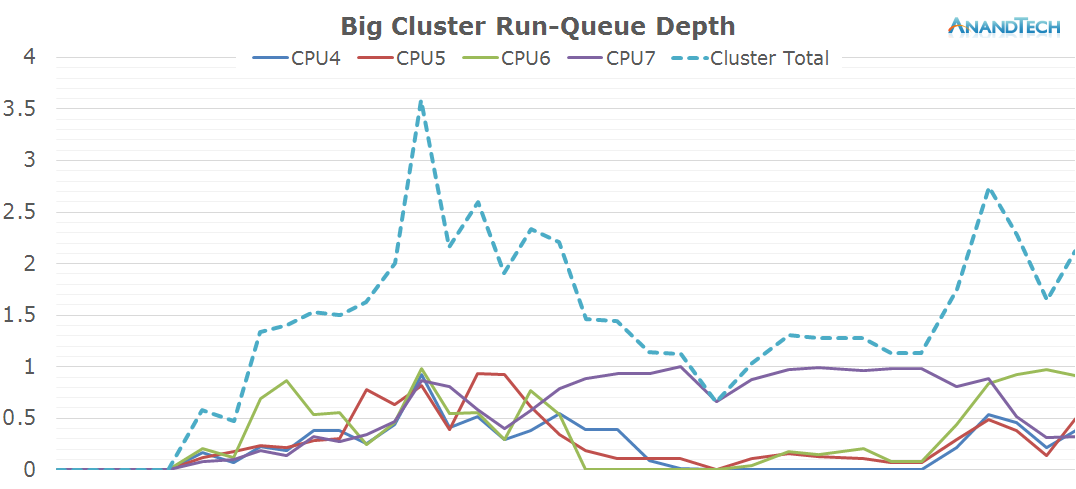
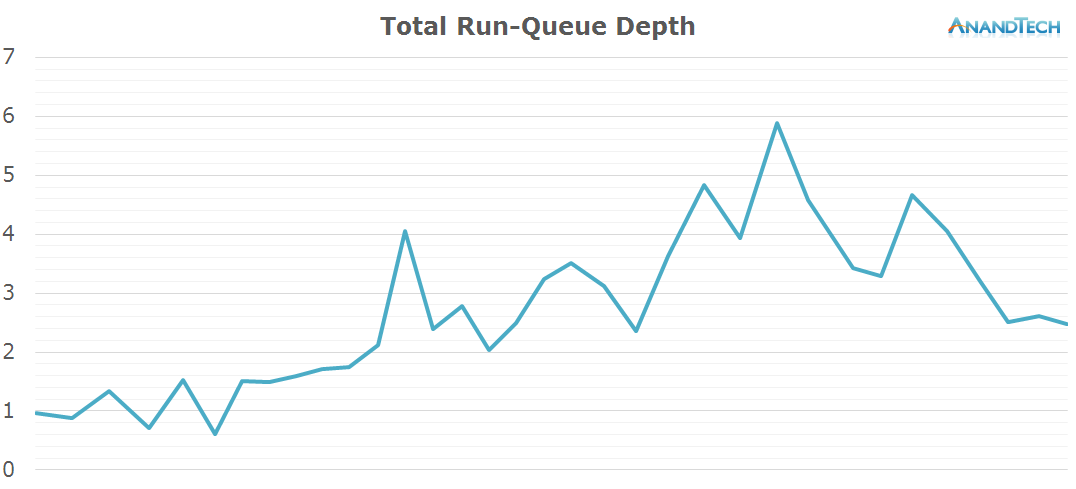
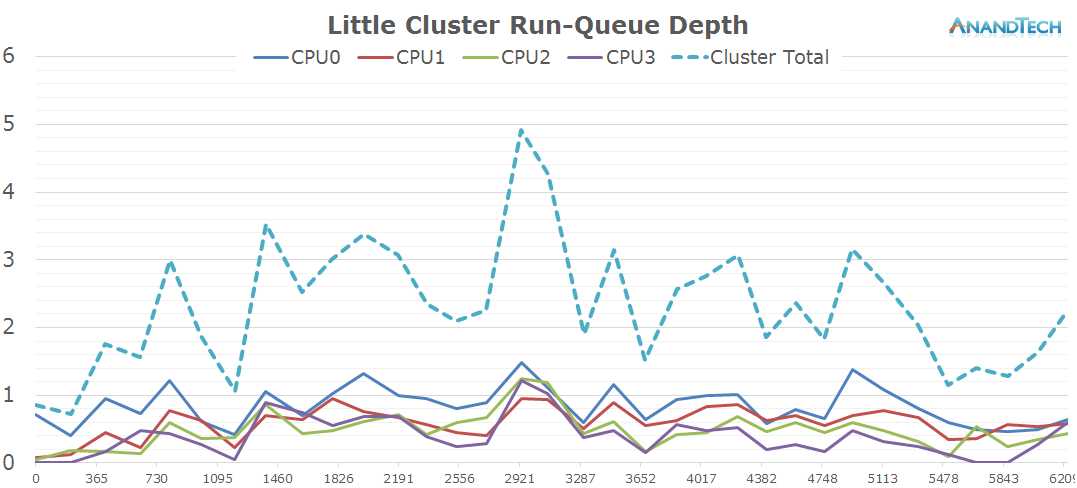
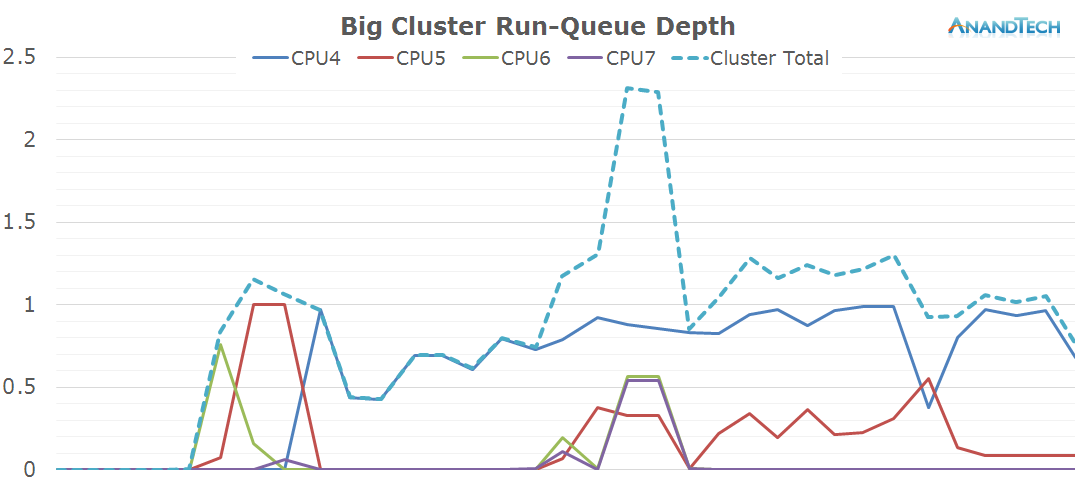
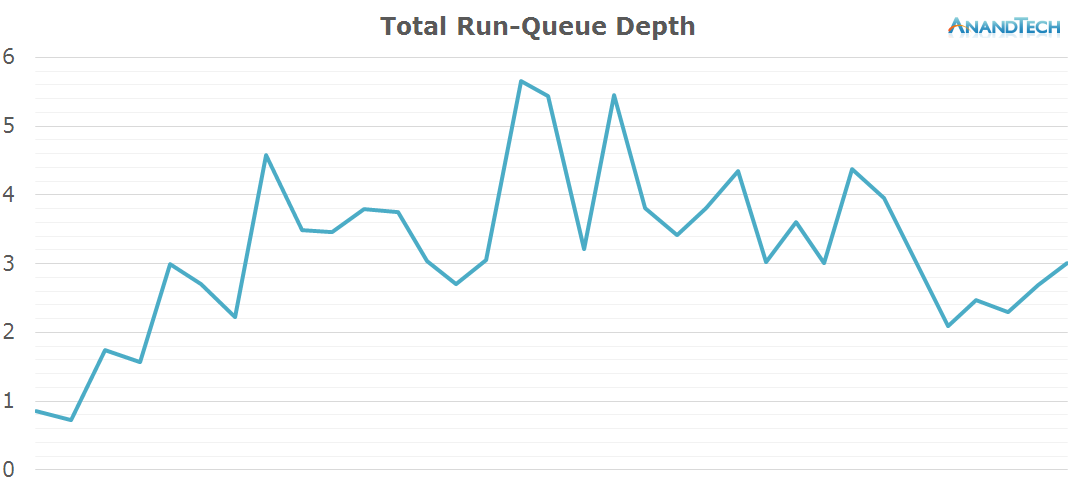
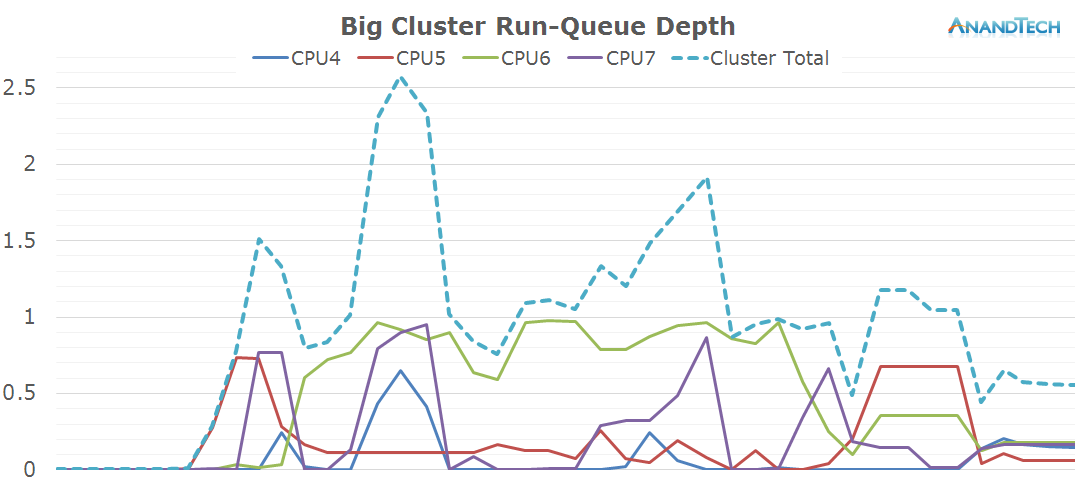
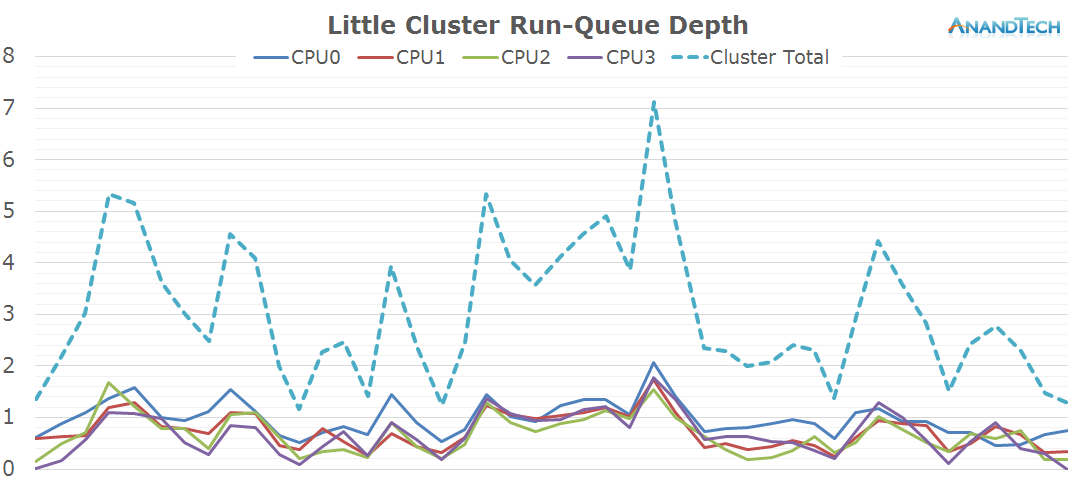
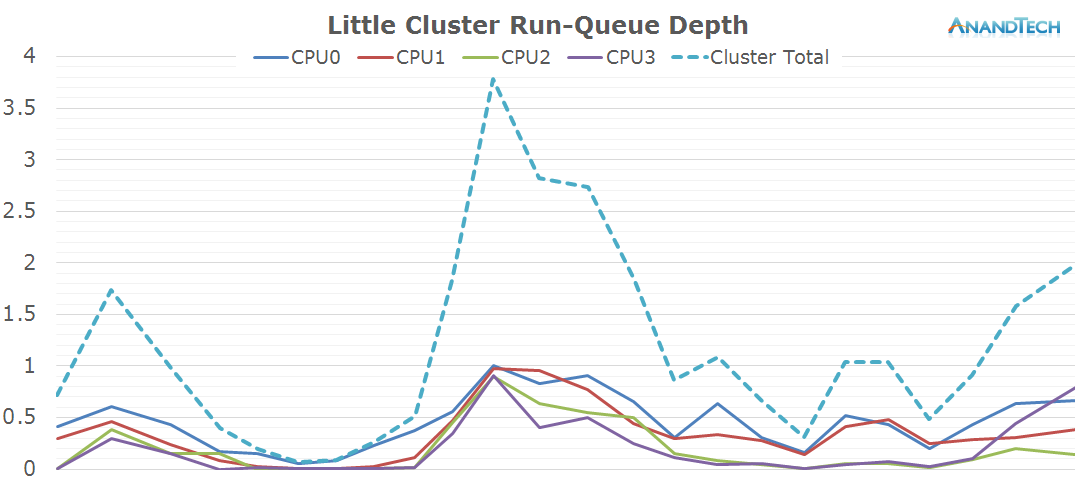
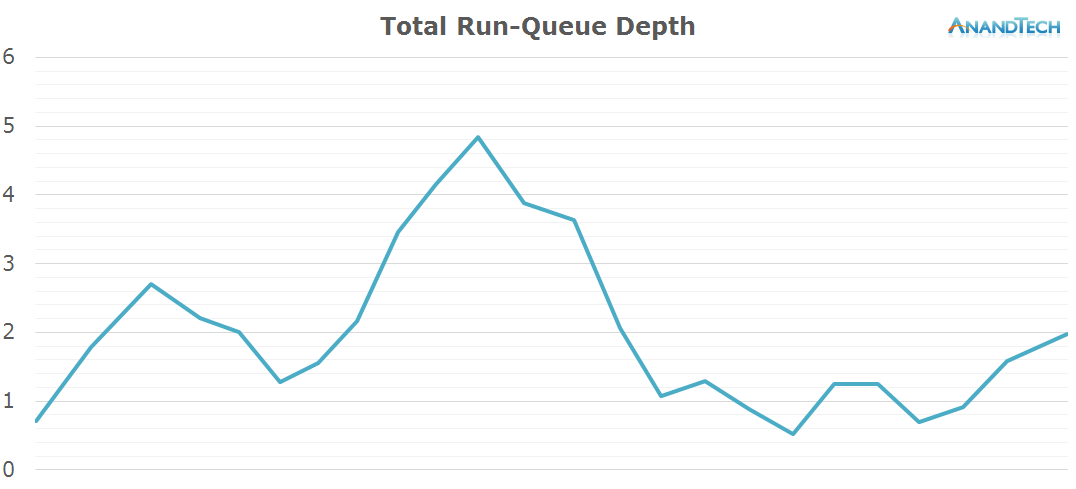
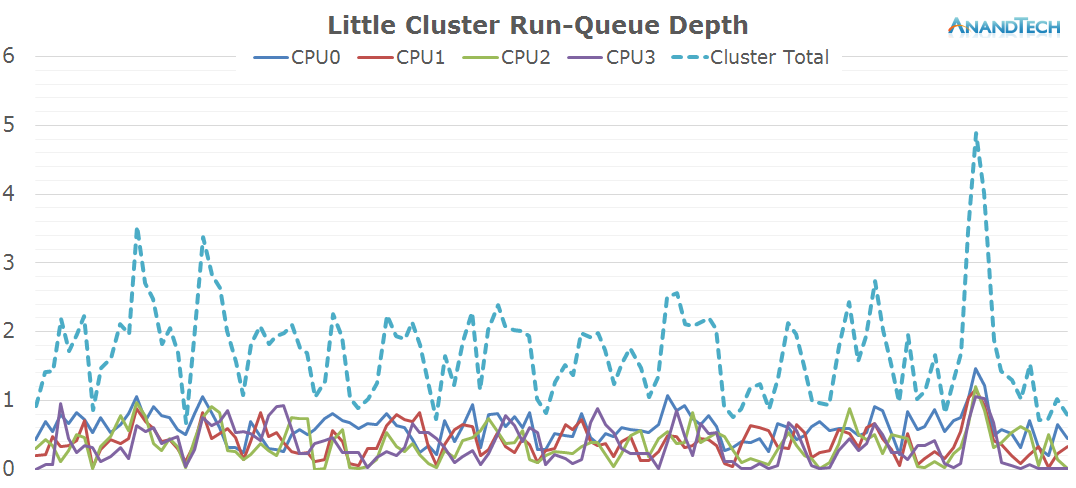
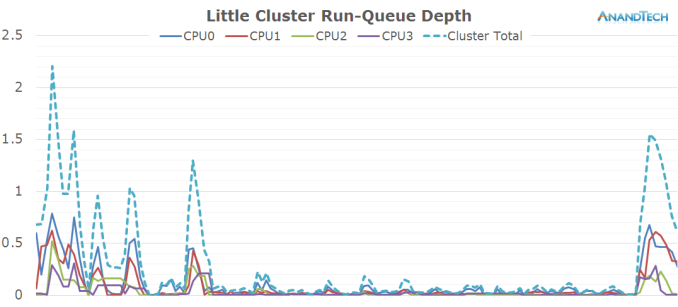
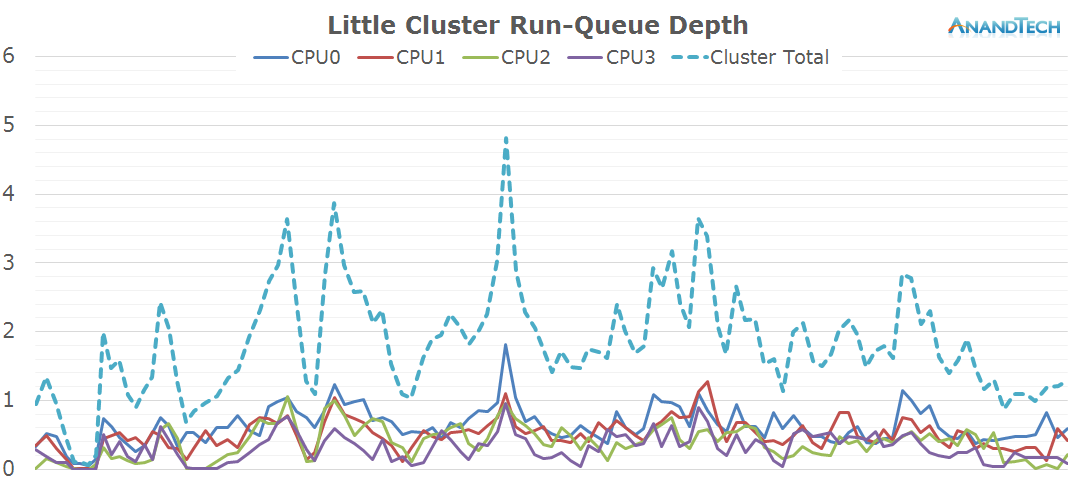
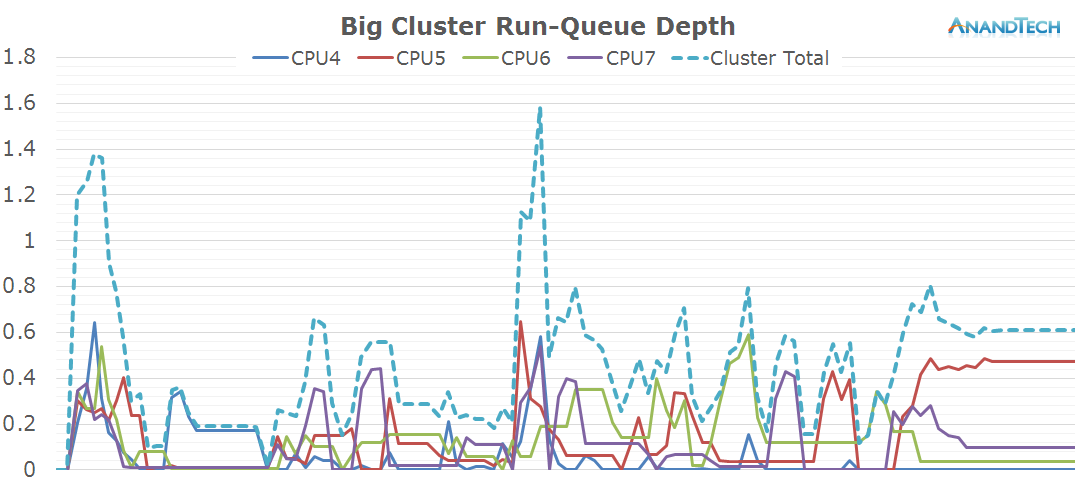
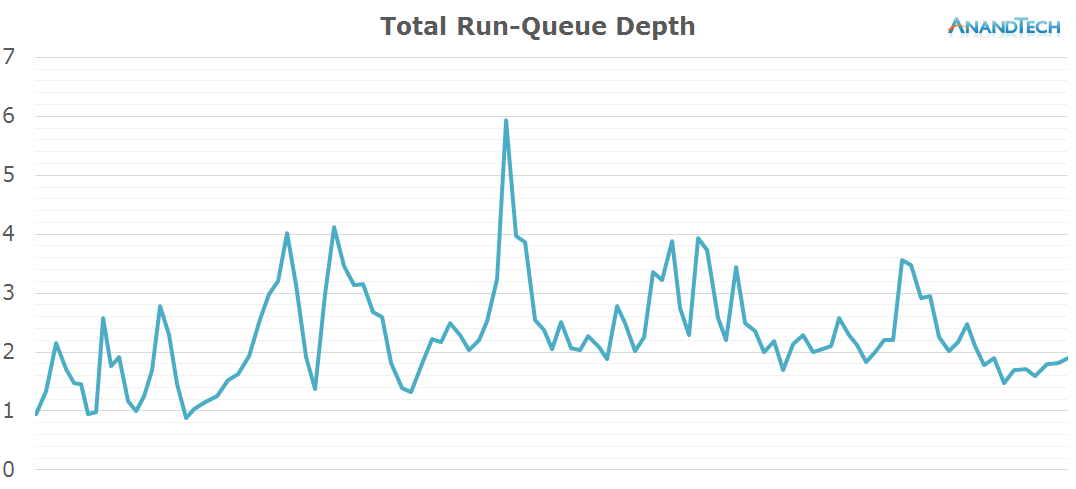
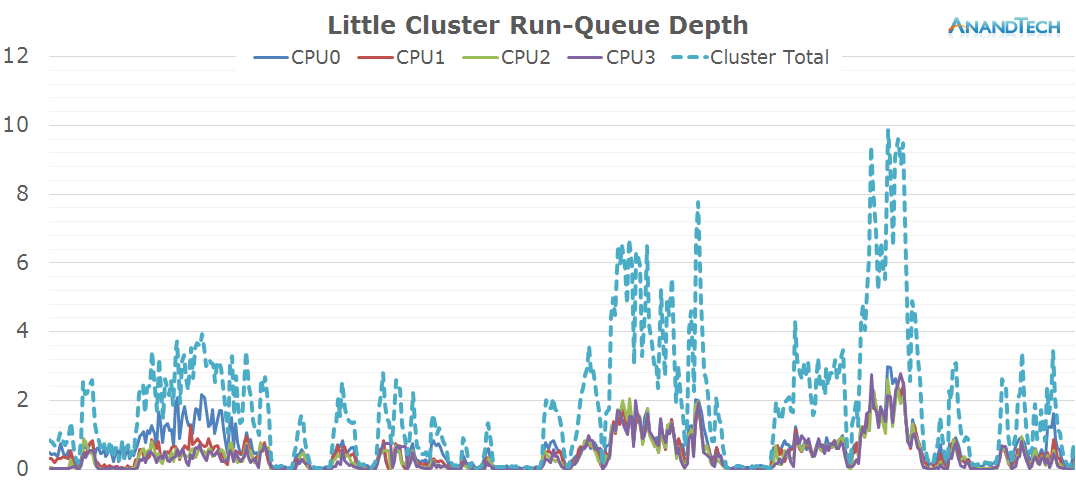
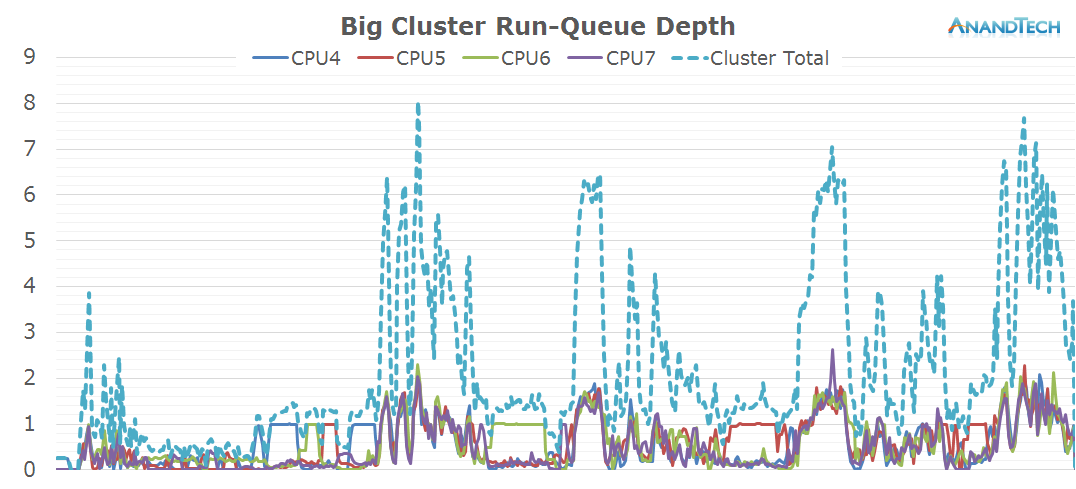
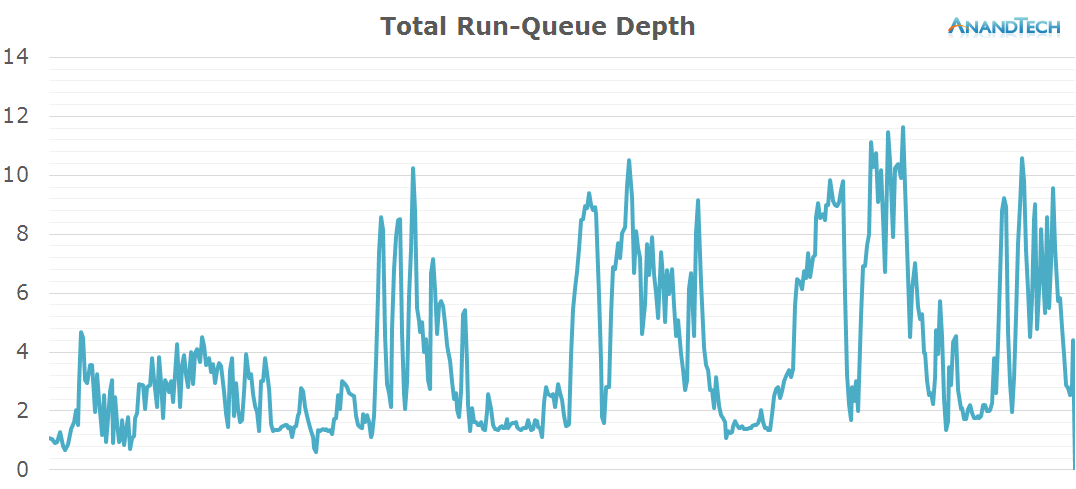
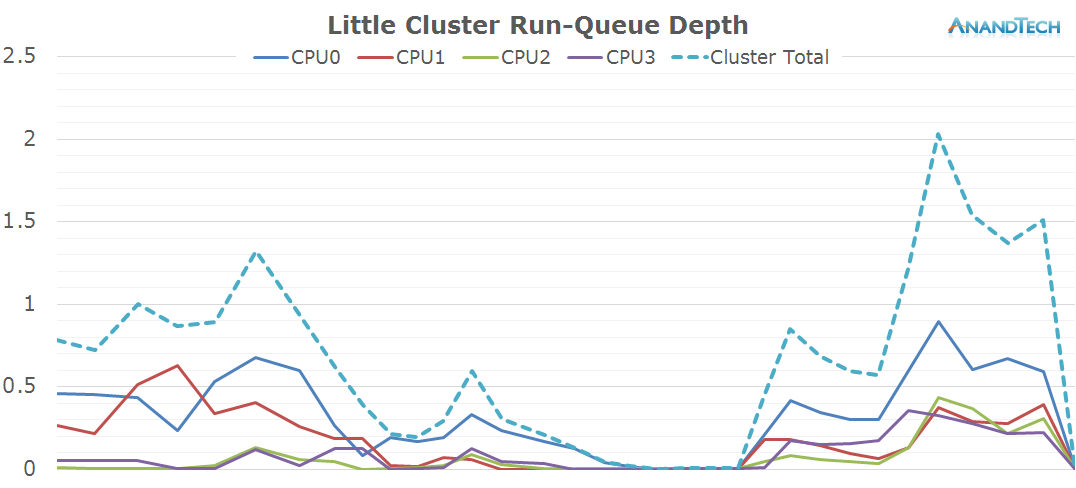
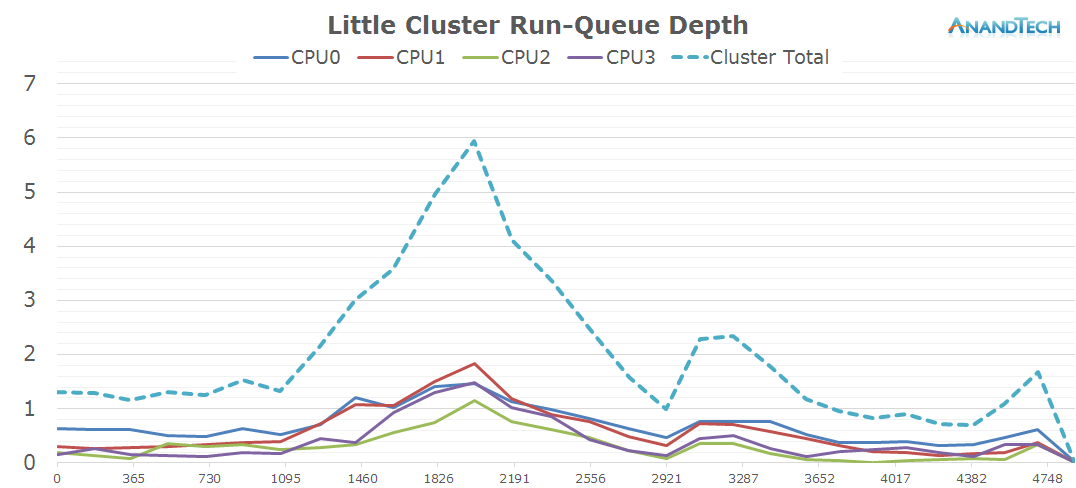
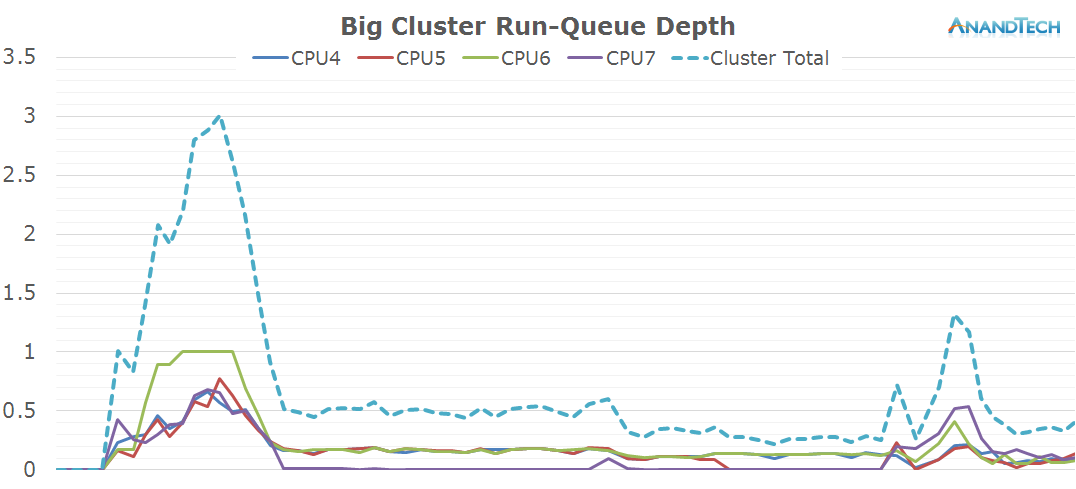
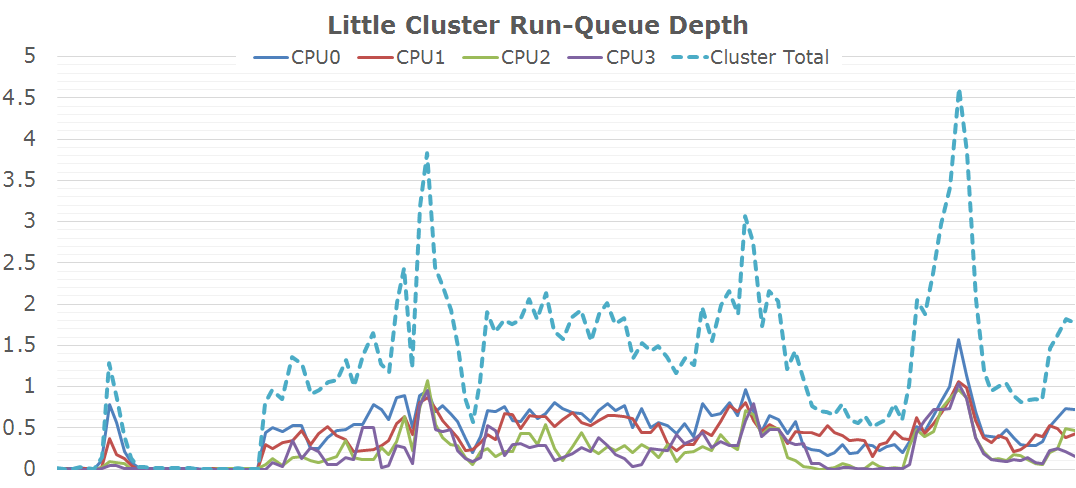
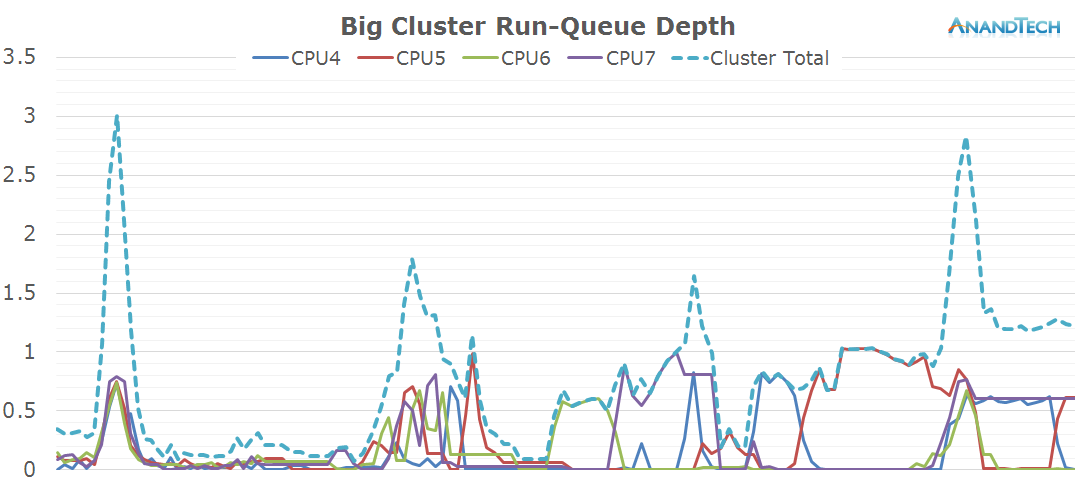
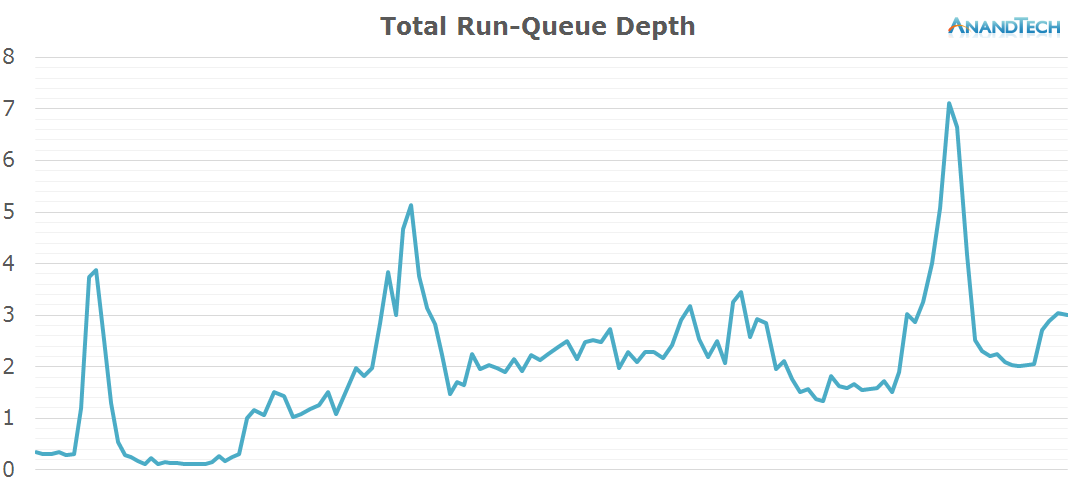
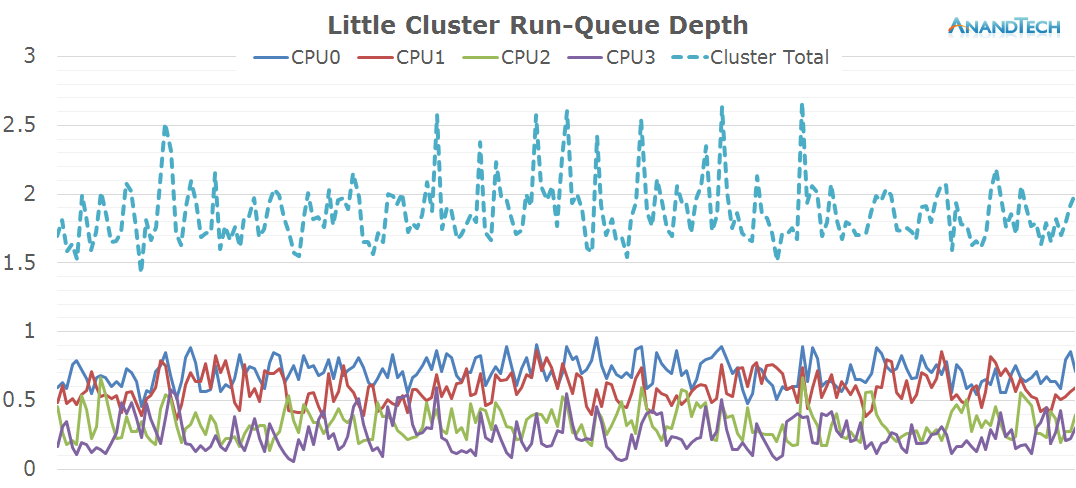
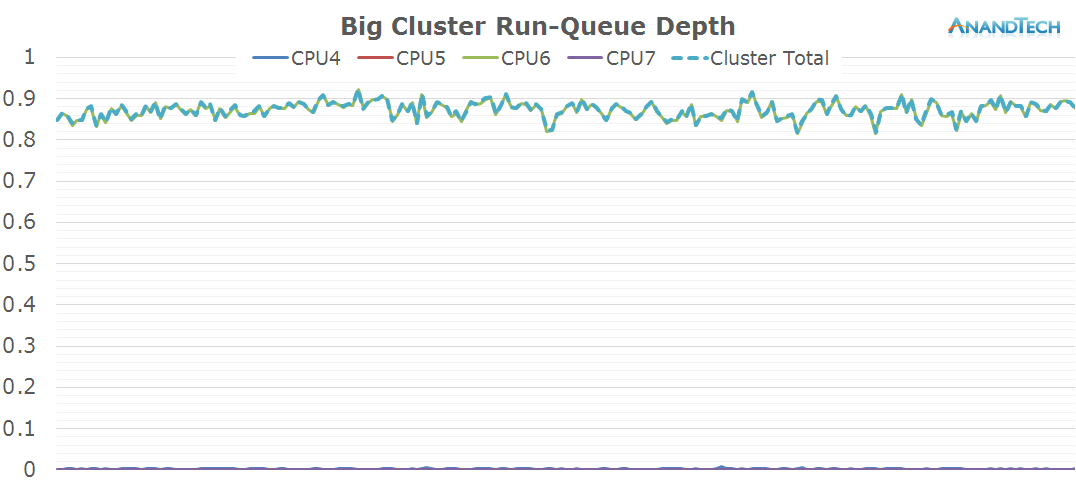
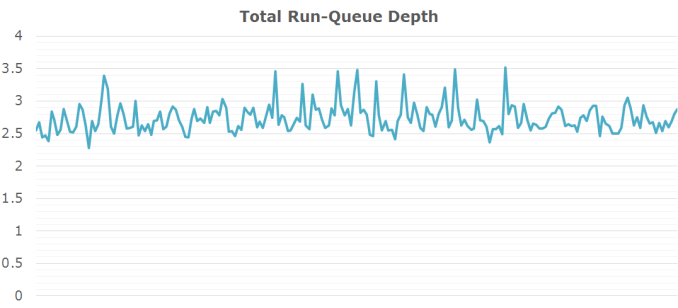
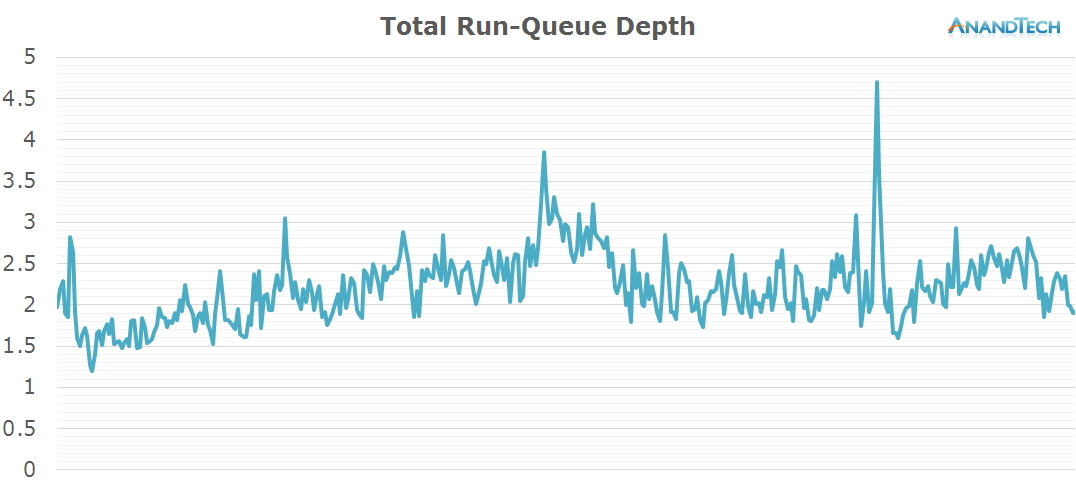
Again, the X-axis throughout the graphs represent the time in milliseconds. This time the Y-axis represents the rq-depth of each CPU. I also included the sum of the rq-depths of all CPUs in a cluster as well the sum of both clusters for the system total in a separate graph.
The values can be interpreted similarly to the load-average metrics, only this time we have a separate value for each CPU. A run-queue depth of 1 means the CPU is loaded 100% of the time, 0.2 means the CPU is loaded by only 20%. Now the interesting metric comes for values above 1: For anything above a rq-depth of 1 it means that the CPU is preempting between multiple processes which cumulatively exceed the processing power of that CPU. For example in the above graph we have some per-CPU peaks of ~2. It means the CPU has at least two threads on that CPU and they each share 50% of the compute-time of that CPU, i.e. they’re running at half speed.
The Data And The Goals
On the following pages we’ll have a look at about 20 different real-world often encountered use-cases where we monitor CPU frequency, power states and scheduler run-queues. What we are looking for specifically is the run-queue depth spikes for each scenario to see just how many threads are spawned during the various scenarios.
The tests are run on Samsung's Galaxy S6 with the Exynos 7420 (4x Cortex A57 @ 2.1GHz + 4x Cortex A53 @ 1.5GHz) which should serve well as a representation of similar flagship devices sold in 2015 and beyond.
Depending on the use-cases, we'll see just how many of the cores on today's many-core big.LITTLE systems are used. Together with having power management data on both clusters, we'll also see just how much sense heterogeneous processing makes and just how much benefit one can gain from it.
S-Browser - AnandTech Article
We start off with some browser-based scenarios such as website loading and scrolling. Since our device is a Samsung one, this is a good opportunity to verify the differences between the stock browser and Chrome as we've in the past identified large performance discrepancies between the two applications.
To also give the readers an idea of the actions logged, I've also recorded recreations of the actions during logging. These are not the actual events represented in the data as I didn't want the recording to affect the CPU behaviour.
We start off by loading an article on AnandTech and quickly scrolling through it. It's mostly at the beginning of the events that we're seeing high computational load as the website is being loaded and rendered.
Starting off at a look of the little cluster behaviour:
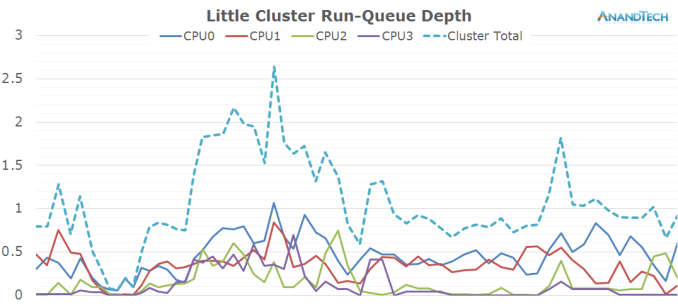
The time period of the data is 11.3s, as represented in the x-axis of the power state distribution chart. During the rendering of the page there doesn't seem to be any particular high load on the little cores in terms of threads, as we only see about 1 little thread use up around 20% of the CPU's capacity. Still this causes the cluster to remain at around the 1000MHz mark and causes the little cores to mostly stay in their active power state.
Once the website is loaded around the 6s mark, threads begin to migrate back to the little cores. Here we actually see them being used quite extensively as we see peaks of 70-80% usage. We actually have bursts where may seem like the total concurrent threads on the little cluster exceeds 4, but still nothing too dramatically overloaded.
Moving on to the big cluster:
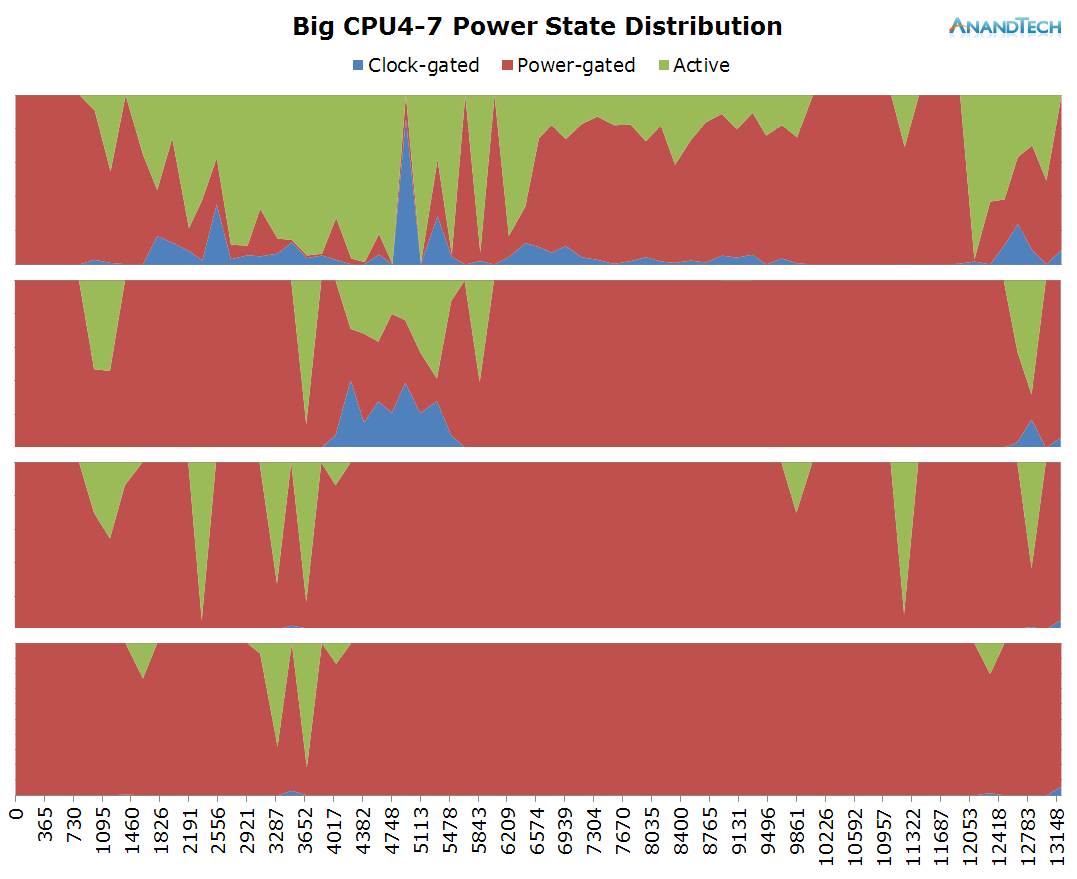
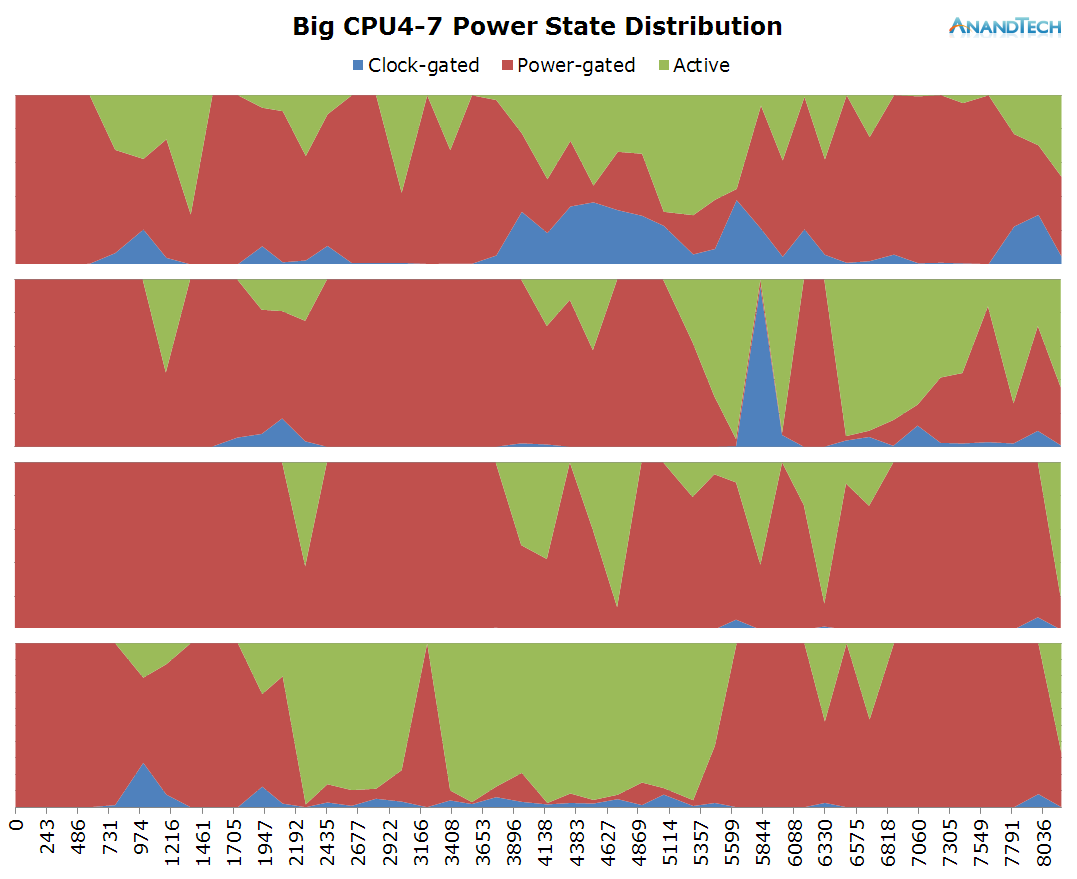
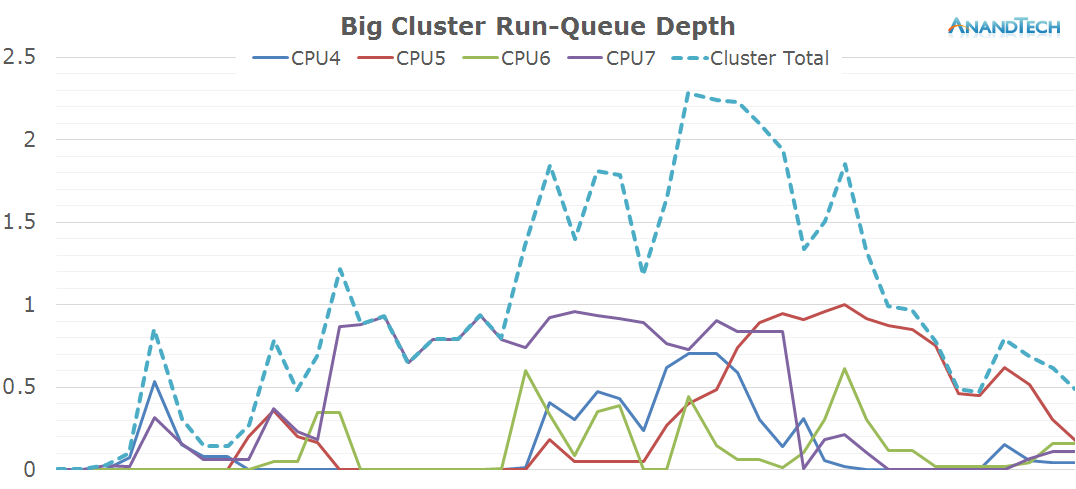
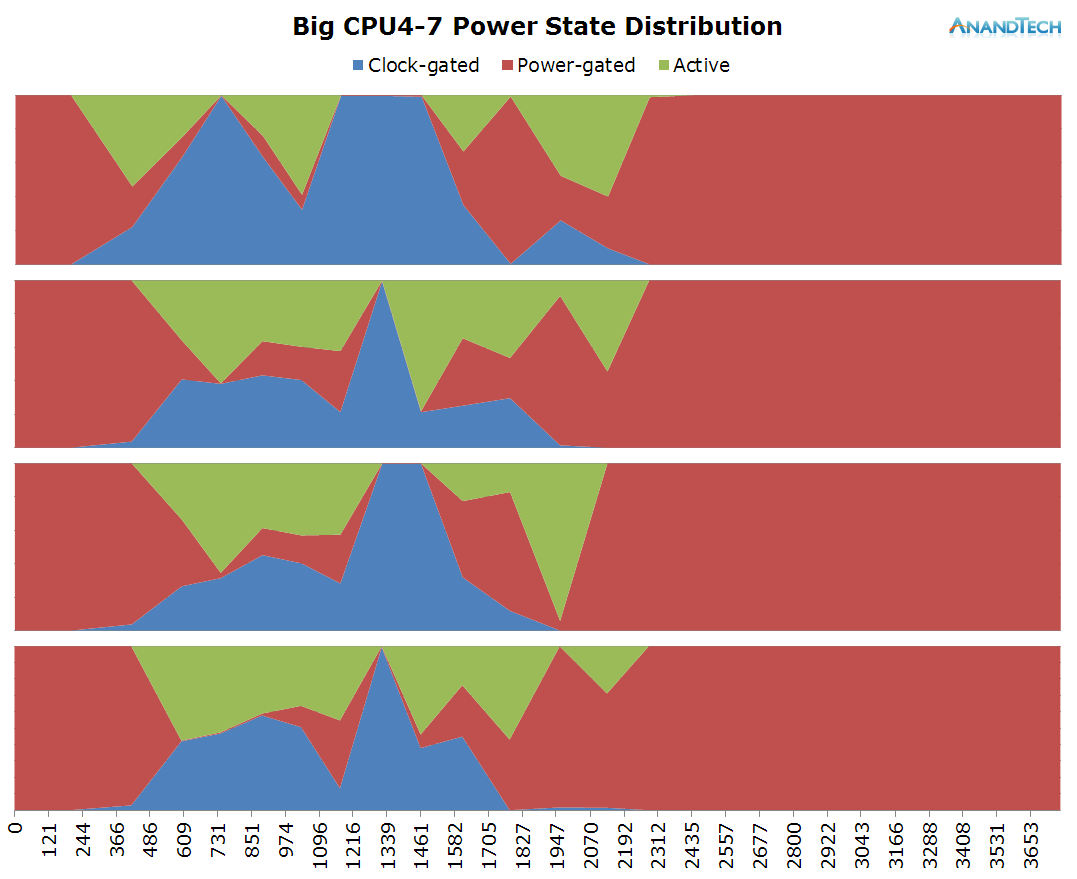
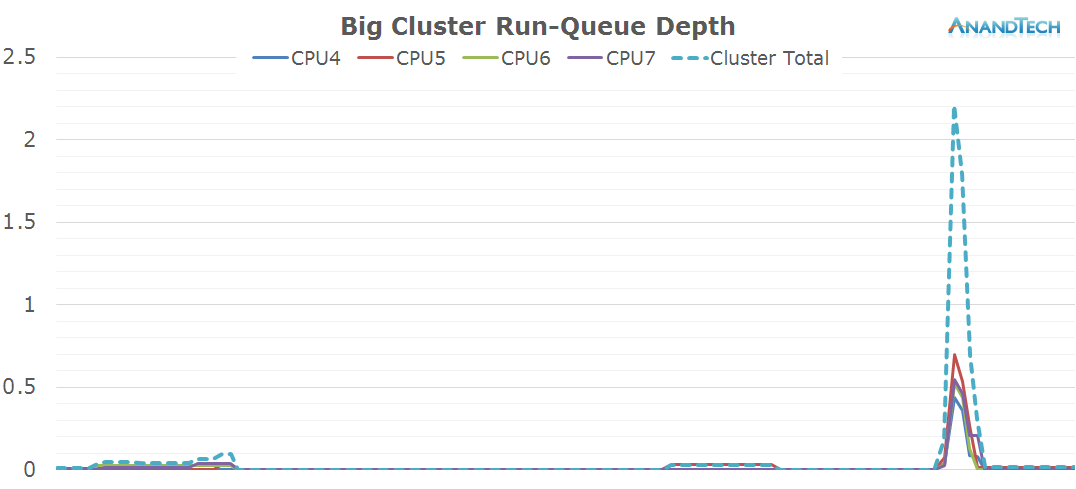
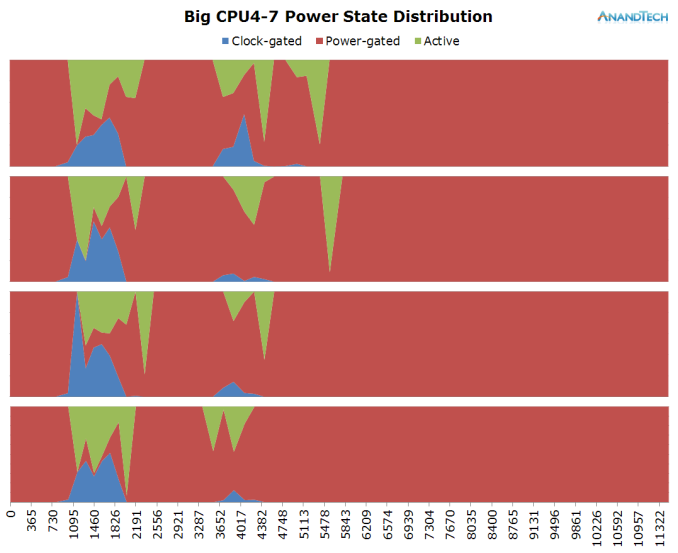
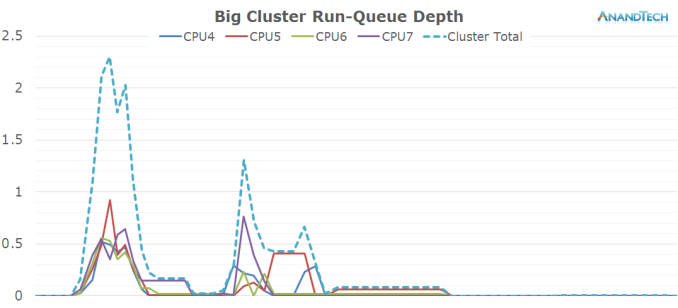
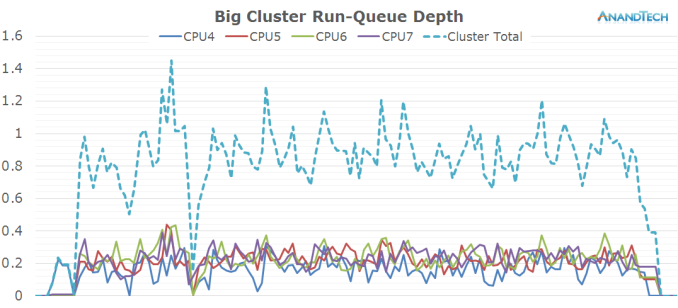
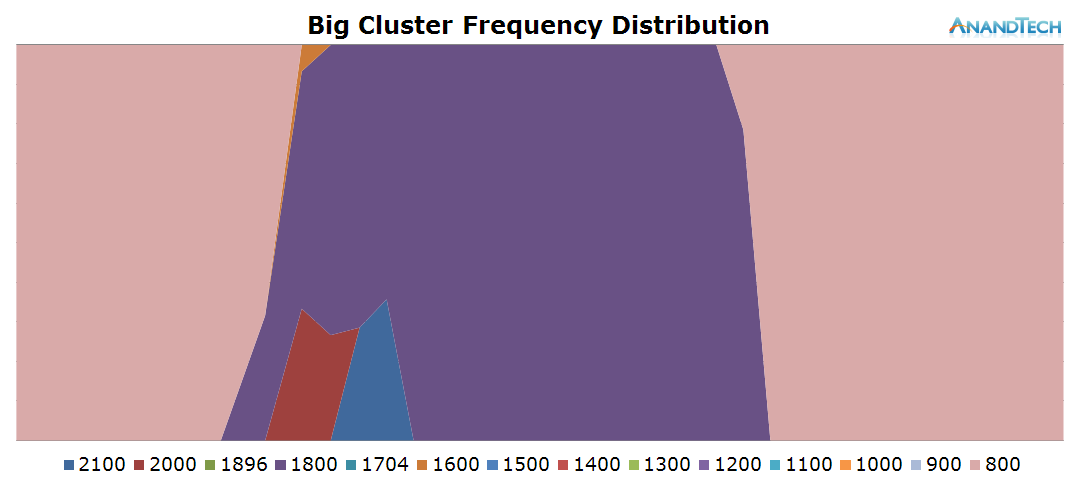
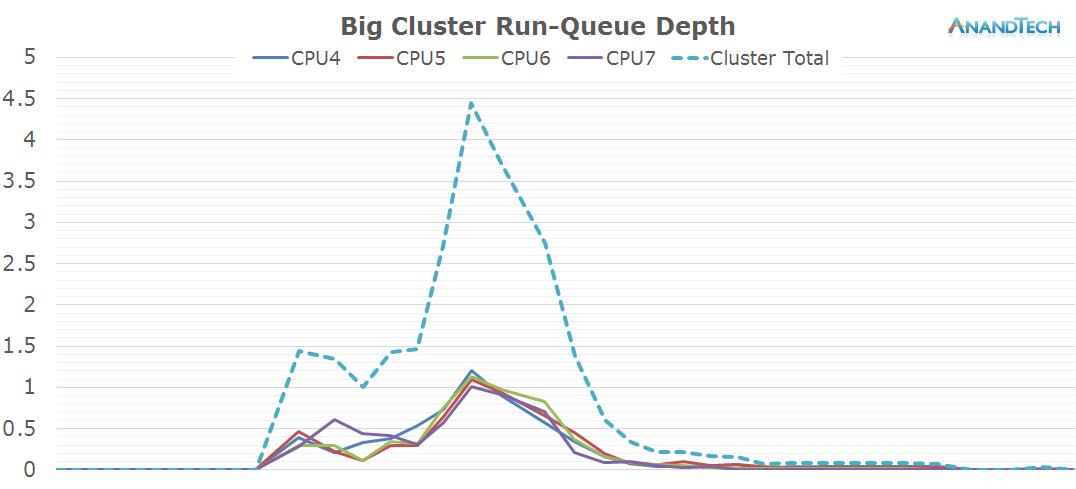
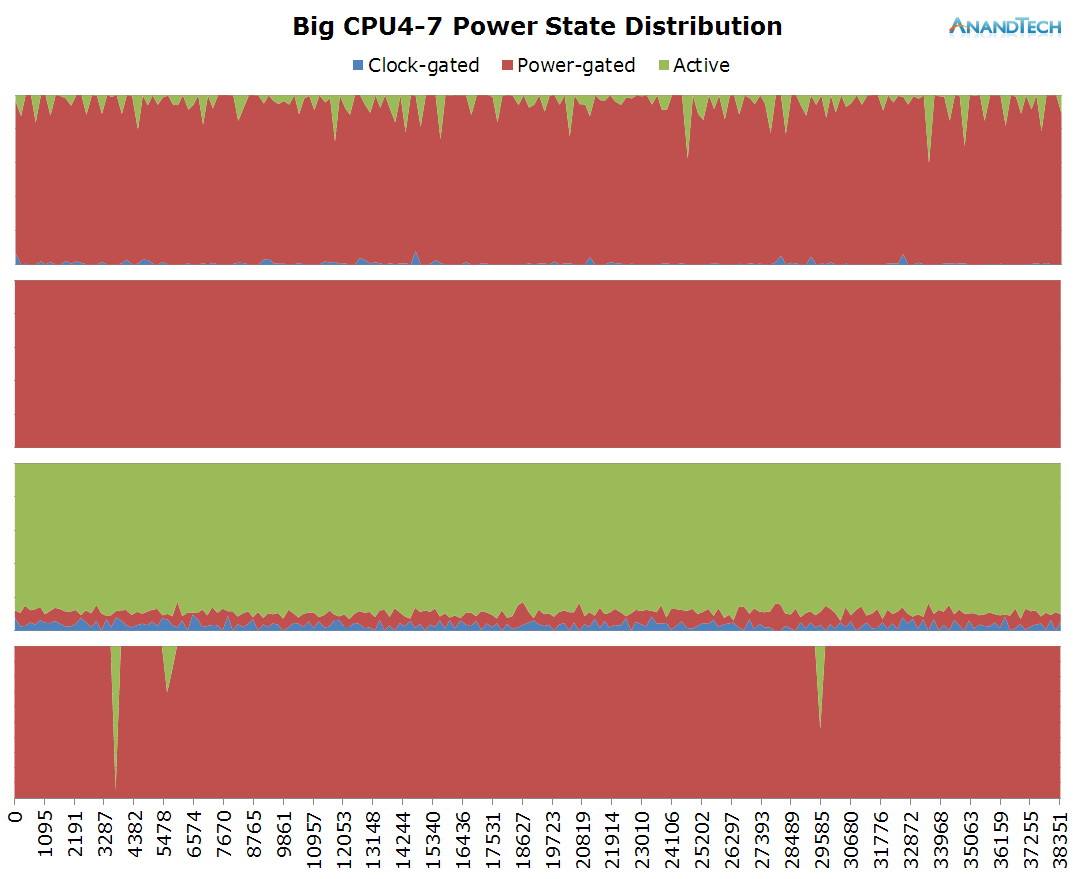
On the big cluster, we see an inversion of the run-queue graph. Where the little cores didn't have many threads placed on them, we see large activity on the big cluster. The initial web site rendering is clearly done by the big cluster, and it looks like all 4 cores have working threads on them. Once the rendering is done and we're just scrolling through the page, the load on the big cluster is mostly limited to 1 large thread.
What is interesting to see here is that even though it's mostly just 1 large thread that requires performance on the big cores, most of the other cores still have some sort of activity on them which causes them to not be able to fall back into their power-collapse state. As a result, we see them stay within the low-residency clock-gated state.
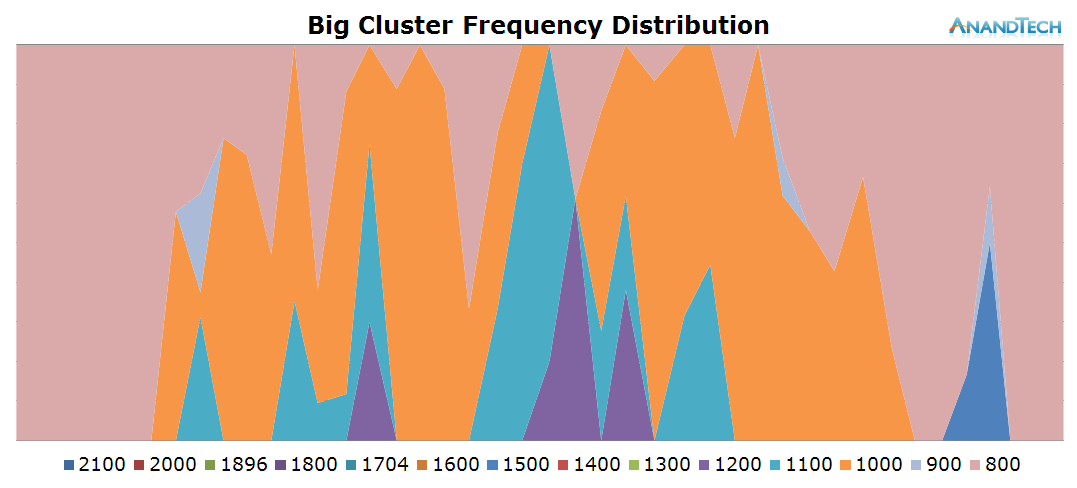
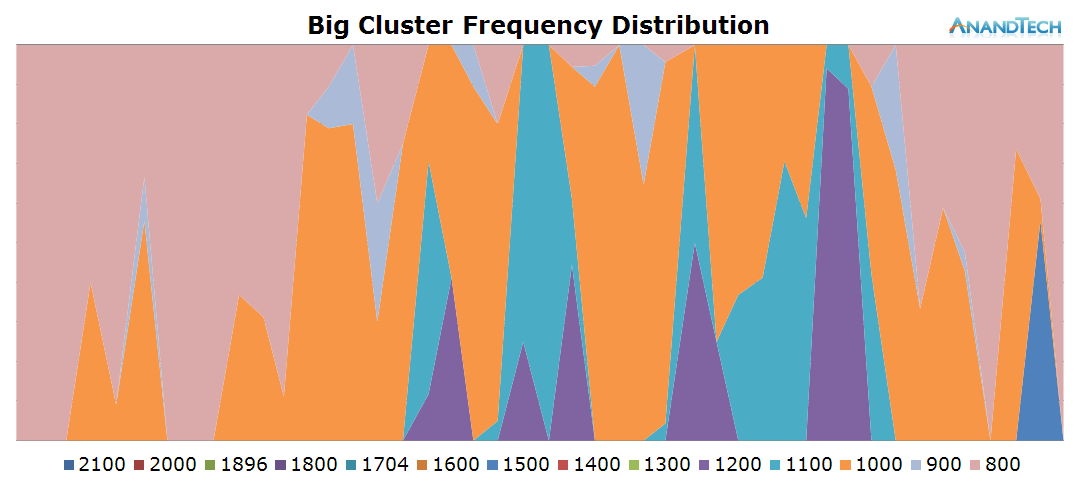
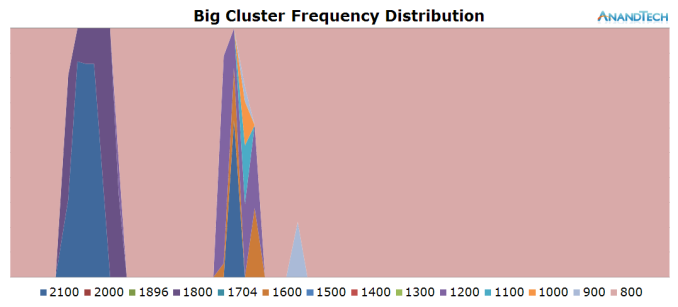
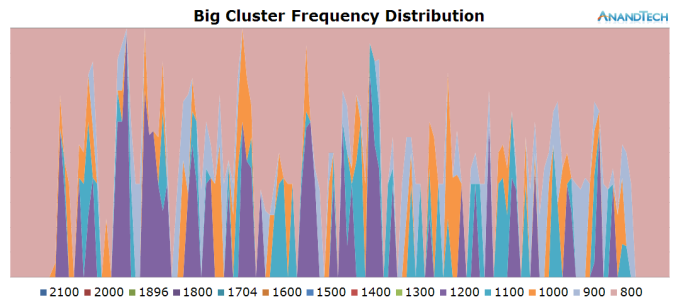
On the frequency side, the big cores scale up to 1300-1500 MHz while rendering the initial site and 1000-1200 while scrolling around the loaded page.
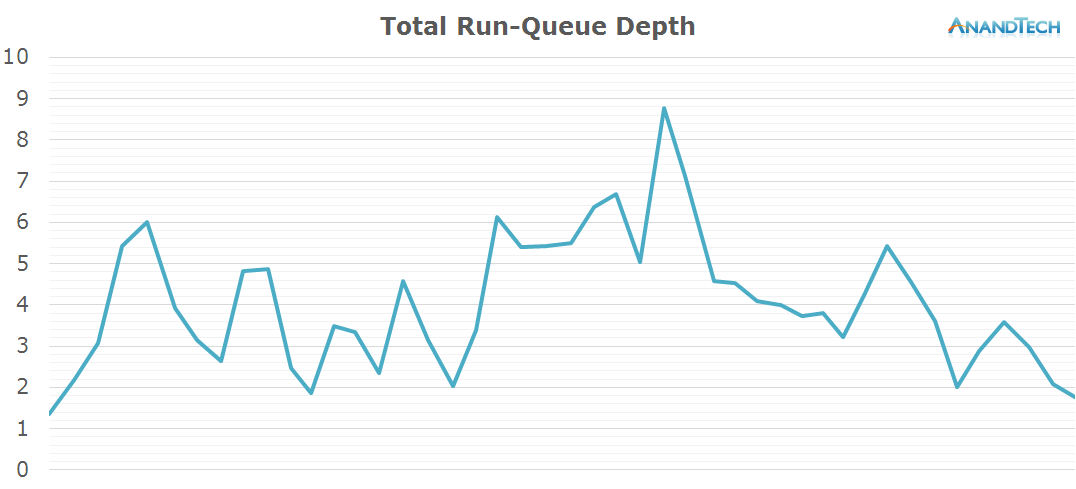
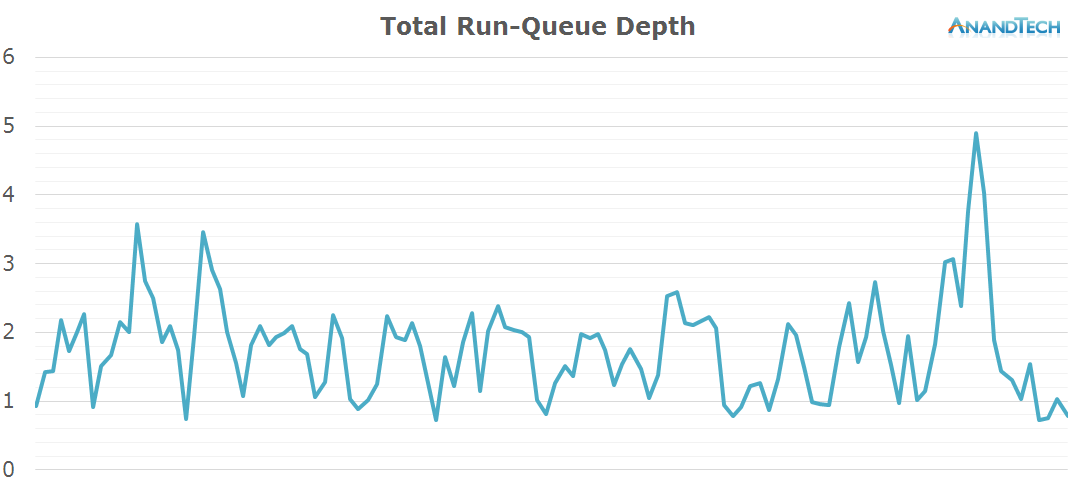
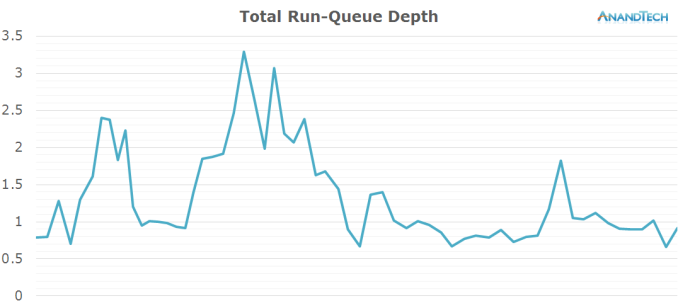
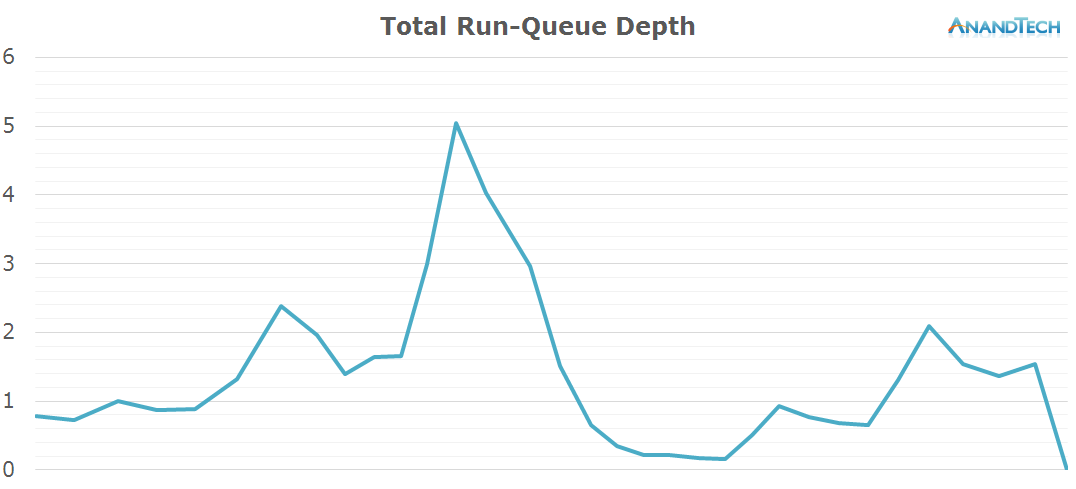
When looking at the total amount of threads on the system, we can see that the S-Browser makes good use of at least 4 CPU cores with some peaks of up to 5 threads. All in all, this is a scenario which doesn't necessarily makes use of 8 cores per-se, however the 4+4 setup of big.LITTLE SoCs does seem to be fully utilized for power management as the computational load shifts between the clusters depending on the needed performance.
S-Browser - AnandTech Frontpage
Again staying with the S-Browser, we check the behaviour of just pure web-page rendering. This time we load the AnandTech front-page without scrolling through the page. The page is slightly heavier as we have more graphical elements as opposed to text on the previous article page.
This time around, we a more even distribution of the load on the little cores. Again, most of the 4 CPU cores are active and have threads placed onto them, averaging about 2.5 fully loaded cores.
The frequency distribution is much more variable in this scenario, as the cluster makes wide usage of the frequency range available to itself. On the power state distribution chart we see that most CPUs are still able to enter their power-gating states, indicating that we're mostly handling very short bursty loads.
The biges cores seems much less loaded in this scenario, as most of the time except for a small peak we only have 1 large thread loading the cluster. Because of this, we expect the other cores to be shut down and if we look at the power state distribution we guessed correctly.
The total amount of threads on the system doesn't change much compared to the previous scenario: The S-Browser still manages to actively make good use of up to 4 cores with the occasional burst of up to 5 threads.
Chrome - AnandTech Frontpage
Off the bat we see quite a large difference in the power state distribution graphs. Chrome seems to place much higher load on the little cores compared to S-Browser. When looking at the run-queue chart we see that indeed all cores are almost at their full capacity for a large amount of time.
What stands out though is a very large peak around the 4s mark. Here we see the little cores peak up to almost 7 threads, which is quite unexpected. This burst seems to overload the little cluster's capacity. The frequency also peaks to 1.3GHz at this point. The reason we don't see it go higher is probably that the threads are still big enough that they're picked up by the scheduler and migrated over to the big cluster at that point.
The big cores also see a fair amount of load. Similarly to the S-Browser we have 1 very large thread that puts a consistent load on 1 CPU. But curiously enough we also see some significant activity on up to 2 other big cores. Again, in terms of burst loads we see up to 3 big CPUs being used concurrently.
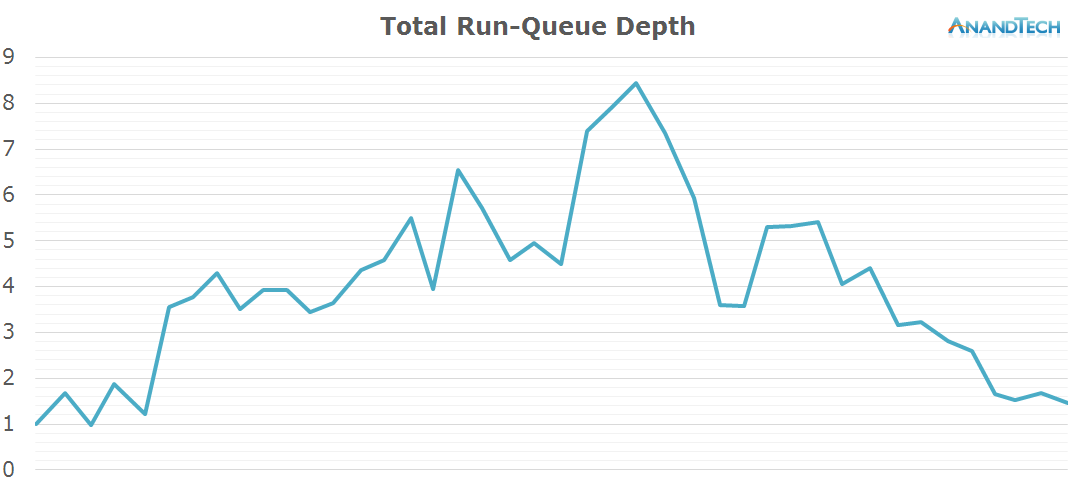
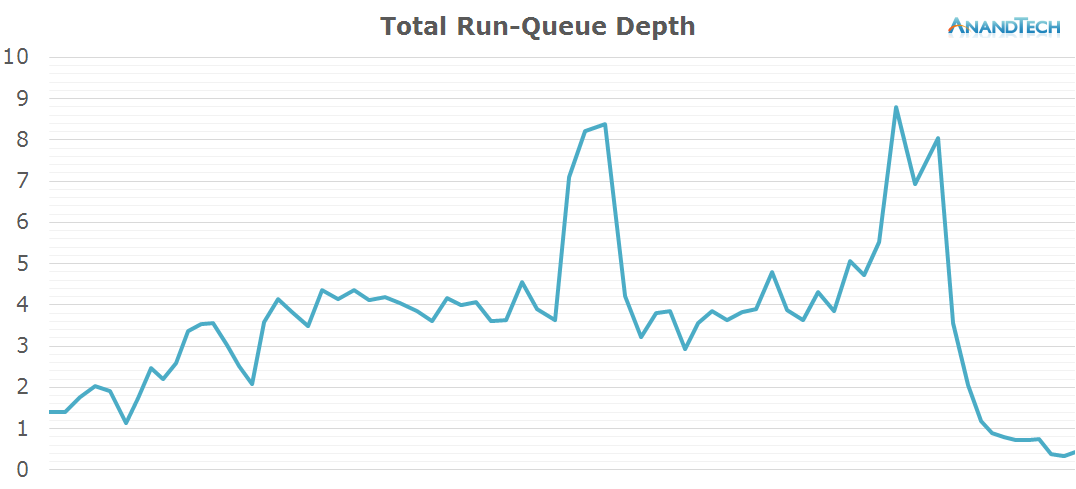
The total run-queue depths for the system looks very different for Chrome. We see a consistent use of 4-5 cores and a large burst of up to 8 threads. This is a very surprisng finding and impact on the way we perceive the core count usage of Chrome.
Chrome - BBC Frontpage
The little core data doesn't look much different than what we saw on the AnandTech frontpage. The little cores see a consistent high load, with a fairly large peak towards the main rendering phase of the page.
Chrome again seems to cause the system to spawn more threads than what the little cluster can accomodate.
The big cores also behave similarly to what we saw on the AnandTech front-page. There's a consistant load of a single large thread with some bursts where up to all 4 CPUs are doing some processing.
The total run-queue depths for the system again confirm what we saw in the previous scenario: Chrome is able to consistently make use of a large amount of threads, so that we see use of up to 6 CPUs with small bursts of up to almost 9 threads.
What is interesting about the Chrome results is that most of the threads are placed on the little cores, meaning we have a large amount of small threads. Because the migration mechanisms of HMP don't migrate threads below a certain performance threshold, this causes some oversaturation of the little CPU cluster.
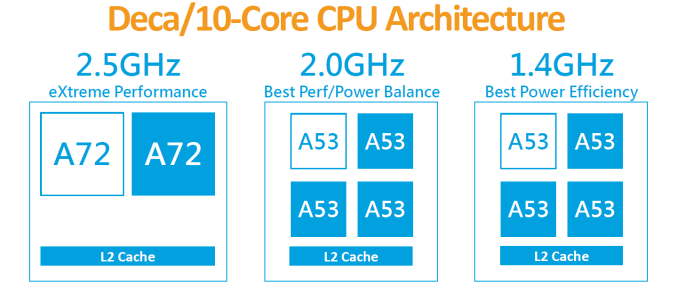
This is an interesting implication for non-heterogeneous 8 core designs such as seen from MediaTek. In such a scenario having 8 little cores at more or less the same performance capacity would indeed make quite some sense. It's again MediaTek's X20 design with 2 clusters of 4 cores and a cluster of 2 high performance cores which comes to mind when looking at these results, as I can't help but think that this would be a use-case which would make perfect sense for that SoC.
Hangouts Launch
The duration of the test this time is only 3.6 seconds. During the initial application launch, we don't see much activity on the little cores. Cores 1-3 are mostly power-gated and we see that there's little to no threads placed onto the cluster during that period. Once the app opened, we see the threads migrate back onto the little cluster. Here we see full use of all 4 CPU cores as each core has threads placed on it doing activity.
This is the perfect burst-scenario for the big cores. The application launch kicks in the cores into high gear as they reach the full 2.1GHz of the SoC. We see that all 4 cores are doing work and have thread placed on them. Because of the fine granularity of the load, we see the CPUs rarely enter the power-gating state in this burst period as the CPU Idle governor prefers the shallower WFI clock-gating state. As a reminder, on the Exynos 7420 this state is setup for target residency times of 500µS.
In general, the workload is optimized towards 4-core CPUs. Because 4x4 big.LITTLE SoCs in a sense can be seen as 4-core designs, we don't see an issue here. On the other hand, symmetric 8-core designs here would see very little benefit from the additional cores.
Hangouts Writing A Message
On the little cores we see a very variable load. In general, it looks like all 4 little cores are used at medium load. CPU frequency as well doesn't look to reach the higher frequency states and tends to fluctuate on the lower-end of the available range.
The big cores aren't active at all. It's only when sending the message that the cores kick into gear for a very short burst. The rest of the time, they're residing on at minimim frequency in their power-gated states.
As the big cores didn't have much scheduled on them, the total rq-graph for the whole system doesn't look very different from the one on the little cores. Writing messages is definitely a low-end task that doesn't require too much processing power.
Reddit Sync Launch
The little cores don't look to have significant load put on them. We only ever see about 2 threads of constant load, with some short spikes were all 4 CPUs are loaded on medium capacity.
The moment the app is loaded all threads migrate onto the big cores for maximum performance. We also see some usage on the big cores when loading the content, but again, the actual number of CPUs used is rather limited as there is only ever about 1 big thread in use.
Overall the app launch doesn't seem to take much advantage of advanced multi-threading as we just manage to peak at 3 threads in the run-queue.
Reddit Sync Scrolling
The little cores in this scenario are virtually sitting idle as for most of the time we don't have much activity placed on them.
The big core activity in this scenario is interesting: While we see all 4 CPUs having activity placed on them, the threads never manage to exceed ~30-35% load capacity. This is also quite the extreme scenario in terms of the power state distribution: It seems the load on the cores is so fine-grained that the CPU Idle system greatly prefers to choose clock-gating state instead of the power-collapse state. The CPU frequency points out that we're also dealing with some very burst loads as we see the cluster clock up to 1.7GHz.
Again, in terms of actual total run-queue depth this task could have easily been done by a 2-core SoC such as Apple's A6/7/8 without losing on performance. What one has to consider though is that the per-CPU load on such a SoC would be much higher, requiring higher single-CPU performance or frequency. Because the app actually manages to spread out the load equally over 4 CPUs, it should actually be able to take advantage of pararellism for the sake of power efficiency instead of performance.
Play Store Open & Scroll
The little cores all have significant load placed onto them. It looks like the app multi-threads well in this scenario and the little threads are well fitted to accomodate the load that is placed onto them.
Surpsingly, we also see the big CPUs having some continuous load. The app launch itself triggers the big cluster to go to full speed of 2.1GHz and migrate threads onto all 4 CPUs. Scrolling through the page also loads at least 1 significant big thread. The CPU's frequency remains quite moderate though as we only see some small bursts to up to 1GHz while the rest of the time the big cores idle on the minimum 800MHz frequency.
Overall, the Play Store app also seems to be optimized and aimed for 4-core designs. Here big.LITTLE seems to work well as we see a mix of small threads with a mix of big threads running concurrently on both clusters.
Play Store App Updates
The Play Store update process seems to be extremely liberal with spawning threads. The little cores are severely over-capacity as we see package updates loading up to 8-9 threads onto the cluster. The two major peaks towards the end of the log especially demonstrate this fact as all CPUs vastly exceed the optimal run-queue depth of 1 when under load, which causes the scheduler to need to preemt between multiple processes.
While it may have been intriguing to see the little cores loaded to such extent, the big cluster seems outright shocking as it as well sees very significant thread-placement. This is one of the rare scenarios where having 4 big cores is not enough. Similarly to the little cores, we see peaks where the run-queue depth vastly exceeds the optimal value of 1.
When looking at the total system run-queue depth, things look for a lack of better description, quite ridiculous. We routinely have peaks where all 8 cores of the system are fully loaded and peak at over 10 threads. It looks like Google is able to massively parallelize the app update process and take advantage of even the highest core-count SoCs. This scenario is absolutely about maximum throughput and performance while utilizing all available hardware resources.
Camera Launching
Nothing much to report on the little cores, we only see some minor load on a couple of threads while the camera is running.
Most of the work when launching the camera was done by the big cluster. Here we see all 4 cores jumping into action. It's interesting to see that at these smaller time-scales we can observe how the CPU frequency lags behind the actual load on the cluster, as the frequency governor maintains a higher frequency for some time before falling back to the idle 800MHz.
Samsung seems to be able to parallelize well the camera application as this is again a sensible scenario that makes good usage of the 4.4 big.LITTLE topology of the SoC.
Camera Still Snapshot
The actual snapshot causes a large spike on the small cores, again overloading them to up to a run-queue depth of up to 6.
The big cores see some minor activity that seems to happen after the actual picture has been captured, so we might be looking at the file saving process.
Overall the picture capture sees quite a surprising peak in terms of the run-queue depth, fully utilizing up to 6 CPUs on the system.
Camera Video Recording
Video recording absolutely makes use of all little cores at once. As we see in the power state distribution chart all cores are predominantly in their active clocked states doing some work. The scheduler run-queue depth also points out that this is a case of at least 4 larger threads that reside on the small cluster.
During the actual video recording the big cluster runs at only 800MHz. Nevertheless, it still sees some activity as 3 cores have some small threads placed on them.
All in all it looks like video recording is about a large number of small threads. There are two spikes in the total run-queue depth that were predominantly caused by the little CPU cluster which pushed the total rq-depth up to 8 in for short moments. I'm not sure what caused the spikes as I remained relatively still during the recording and did no special activity to warrant such behaviour.
Real Racing 3 Launch
At first the load is fully migrated onto the big CPU cluster so we see little to no activity on the little cores. Once the initial opening is done, we see threads migrate back to the small cores.
Beyond the initial app launch, it looks like RR3 isn't too multi-threaded as we only see some short bursts on the big cores, but they never exceed a total run-queue of 1.5 during the main loading sequence.
Overall, the game's rq-depth averages around 2.5 during the main loading sequence with a larger burst of 7 threads when the 3D intro starts playing.
Real Racing 3 Playing
The little cores see at least 3 major threads loaded onto them. The 4th core is doing some work as well, but quite a bit less than the first 3. What is extremely interesting here is the frequency distribution graph: The cores don't settle for any one frequency and make use full use of the full range of the cluster.
The behaviour of the big-cluster is clear-cut. There's only 1 significant thread that ever gets placed on the big cores. This is an ideal scenario for a big.LITTLE architecture as would there have been more than 1 thread, that secondary thread would have suffered from diminished efficiency as it wouldn't be able to run at the best perf/W frequency due to ARM's synchronous frequency planes between CPUs in a cluster.
The power-distribution graph does show the worrying anomaly of seeing CPU4 come out its power-collapse state for very small periods of time. This would be a source of inefficiency of either the scheduler or the CPUIdle framework needing to wake up that core for the sake of simple clean-up work instead of real load.
I think it's pretty safe to come to the conclusion that Real Racing 3 is coded with quad-core CPUs in mind as we see exactly 4 major threads loading the SoC's CPUs to various extent.
Modern Combat 5 Playing
The little cluster looks to behave extremely similar to what we saw in Real Racing 3: Three larger threads keep 3 of the cluster's CPU at relatively busy duty-cycles while we see some limited activity on the 4th core.
The big cluster also seems to behave in a similar fashion. One big main thread causes the bulk of the load while we only have occasional small bursts when threads get migrated onto the big cluster. This time we see a more variable load both in terms of requency and rq-depth instead of the flat-line that could be observed in Real Racing 3.
One interesting behaviour caught in this log was how the main big thread got moved around from CPU6 to CPU4 and then again to CPU5 on the 33s mark in the log.
Even though the total rq-depth might be a bit misleading here while it's showing an average of around 2.5, we can see that in the individual per-CPU runqueues we have 4 major threads at work. Again this is a case of using parallelization for the sake of power efficiency instead of performance. The 3 smaller threads on the little cores could have well been handled by a single larger CPU at higher frequency, but it wouldn't have been nearly as power efficient as spreading them onto the smaller cores.
Overall Analysis & Conclusion
Hopefully we've managed to cover a few of the more common use-cases that are routinely encountered in daily usage on Android and get a good idea of how applications behave. We've seen some quite expected numbers for some use-cases but also stumbled on very large surprises that weren't quite as obvious.
When I started out this piece the goals I set out to reach was to either confirm or debunk on how useful homogeneous 8-core designs would be in the real world. The fact that Chrome and to a lesser extent Samsung's stock browser were able to consistently load up to 6-8 concurrent processes while loading a page suddenly gives a lot of credence to these 8-core designs that we would have otherwise not thought of being able to fully use their designed CPU configurations. In terms of pure computational load, web-page rendering remains as one of the heaviest tasks on a smartphone so it's very encouraging to see that today's web rendering engines are able to make good use of parallelization to spread the load between the available CPU cores.
It's hard to summarize the vast amount data of the last 16 pages in an orderly and correct manner. After all we are talking about extremely varying use-cases and time-scales for each scenario. While averaging the metrics over the course of a scenario might seem a good idea at first, one has to keep in mind that this wouldn't be able to properly represent cases where load peaks for smaller durations. It's these small computational bursts which are most of the time the cause for "lags" and frame-drops. So to better represent these bottle-necks which determine the user-visible cases of application speed and performance, we rather use the 90th percentile of the CPU run-queue depths:
| 90th Percentile Run-Queue Depth Averages | |||
| Little Cluster | Big Cluster | Little + Big Clusters |
|
| S-Browser - AnandTech Article | 2.27 | 2.19 | 3.87 |
| S-Browser - AnandTech FP | 3.12 | 1.25 | 4.15 |
| Chrome - AnandTech FP | 5.69 | 1.84 | 7.10 |
| Chrome - BBC Frontpage | 5.00 | 2.00 | 6.22 |
| Hangouts Launch | 2.77 | 2.11 | 4.01 |
| Hangouts Writing A Message | 2.80 | 0.05 | 2.57 |
| Reddit Sync Launch | 1.84 | 1.11 | 2.38 |
| Reddit Sync Scrolling | 0.95 | 1.03 | 1.46 |
| Play Store Open & Scroll | 2.87 | 0.78 | 3.45 |
| Play Store App Updates | 3.73 | 5.42 | 8.51 |
| Camera: Launch | 1.45 | 2.73 | 2.98 |
| Camera: Still Snapshot | 4.12 | 0.87 | 4.59 |
| Camera: Video Recording | 5.17 | 2.04 | 5.42 |
| Real Racing 3 Launch | 2.16 | 1.33 | 3.26 |
| Real Racing 3 Playing | 2.09 | 0.89 | 2.96 |
| Modern Combat 5 Playing | 2.09 | 0.73 | 2.68 |
I was wary of creating this table as it can be easily misinterpreted: Because run-queue depth averages are not directly representative of the amount of concurrent threads in a given scenario, we lose information when aggregating them for a given cluster or the whole system. This for example happens on the big cluster on the AT article load scenario where the 90th percentile of the aggregate rq-depth reaches 2.19 while in reality this figure is composed of 4 medium-high threads. Readers should thus keep in mind the actual detailed graphs of the preceding pages when reading the table.
While not directly the goal of the article, the collected data also serves as a perfect case-study for heterogeneous big.LITTLE SoCs. We've long seen discussions concerning what the "ideal" big.LITTLE configuration would be. There's several angles to this: the most optimal little and big cluster core counts, and whether we're aiming for performance or power efficiency in each case. In terms of low- to medium-performance threads, we've had several cases where 4 little cores weren't enough. Web page rendering in Chrome in particular seems to be the killer use-case where actually having two clusters of highly efficient cores makes sense.
On the high-performance "big" cluster side, the discussion topic is more about whether 2 or 4 core designs make more sense. I think the decision here is not about performance but rather about power efficiency. A 2-core big-cluster design would provide more than enough performance for most use-cases, but as we've seen throughout our testing during interactive use it's more common than not to have 2+ threads placed on the big cluster. So while a 2-core design could handle bursts where ~3-4 threads are placed onto the big cluster, the CPUs would need to scale up higher in frequency to provide the same performance compared to a wider 4-core design. And scaling up higher in frequency has a quadratically detrimental effect on power efficiency as we need higher operating voltages. At the end of the day I think the 4 big core designs are not only the better performing ones but also the more efficient ones.
This puts one particular vendor in quite of an interesting position: MediaTek. Even if one wouldn't be able to fully saturate a cluster one can still derive power efficiency advantages due to the fact that two small clusters would be able to operate at separate frequencies and thus efficiency points. I've encountered enough scenarios that would in theory fit the Helio X20's tri-cluster design that I'm starting to think that such a design would actually be a very smart choice for current Android devices.
What about more traditional SoC configurations? As mentioned earlier symmetric 8-core designs such as MediaTek's Helio X10 would, contrary to one's expectations, be seemingly able to take advantage of their higher core counts. So while it would be preferable to have higher performance cores such as Cortex A57's or A72's, one has to keep in mind the target market of these architectures are limited to higher-end SoCs. The 8 little-core designs are mostly targeted at the entry- and mid-level where adding a second Cortex A53 cluster can be very cheap way of still providing benefits in every-day usages, particularly in web-browsing.
What is clear though albeit there are corner-cases, is that the vast majority of applications do seem to be optimal for quad-core SoCs. This is why traditional 4-core and 4.4 big.LITTLE designs still appear to make the most sense in terms providing a balanced configuration and making most use of the hardware at hand. For big.LITTLE, even if there were no use-cases where all cores are concurrently used, it's not a big deal as what we are aiming for in heterogeneous systems is power efficiency gains.
This is also the point of the discussion where the debate of the potential detrimental effect of having more cores comes into play: The fact that a SoC has more cores does not automatically mean it uses more power. As demonstrated in the data, modern power management is advanced enough to make extensive use of fine-grained power-gated idle states, thus eliminating any overhead there might be of simply having more physical cores on the silicon. If there are cases (And as we've seen, there are!) which make use of more cores then this should be seen purely as an added bonus and icing on the cake.
What about narrow CPU-core number design philosophies? Would such designs make sense on Android? This is probably another question that our readers will ask themselves when looking at the data. Apple and recently Nvidia with their Denver architecture both choose to keep going the route of employing large 2-core designs that are strong in their single-threaded performance but fall behind in terms of multi-threaded performance.
While for Apple it can be argued that we're dealing with a very different operating system and it is likely iOS applications are less threaded than their Android counter-parts. But there are cases where this doesn't need to be necessarily hold true: For example browser rendering engines, as demonstrated, can be multi-threaded if adapted to do so. Native high-end games which already make use of multiple threads are also unlikely to differ in their threading logic between the platforms.
While such narrow CPU-core designs would have higher performance at a given frequency - it is not a direct indicator of the actual performance/W efficiency that a single thread would have on these chipsets. We still haven't had a chance to make a proper apples-to-apples comparison for these architectures so we're limited to theorycrafting with the data we currently have available to us:
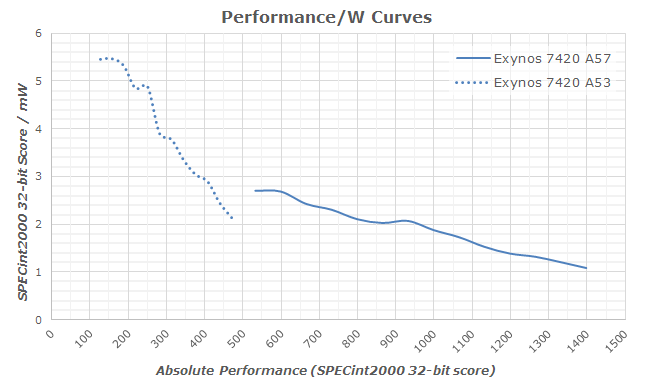
What we see in the use-case analysis is that the amount of use-cases where an application is visibly limited due to single-threaded performance seems be very limited. In fact, a large amount of the analyzed scenarios our test-device with Cortex A57 cores would rarely need to ramp up to their full frequency beyond short bursts (Thermal throttling was not a factor in any of the tests). On the other hand, scenarios were we'd find 3-4 high load threads seem not to be that particularly hard to find, and actually appear to be an a pretty common occurence. For mobile, the choice seems to be obvious due to the power curve implications. In scenarios where we're not talking about having loads so small that it becomes not worthwhile to spend the energy to bring a secondary core out of its idle state, one could generalize that if one is able to spread the load over multiple CPUs, it will always preferable and more efficient to do so.
In the end what we should take away from this analysis is that Android devices can make much better use of multi-threading than initially expected. There's very solid evidence that not only are 4.4 big.LITTLE designs validated, but we also find practical benefits of using 8-core "little" designs over similar single-cluster 4-core SoCs. For the foreseeable future it seems that vendors who rely on ARM's CPU designs will be well served with a continued use of 4.4 b.L designs. Only MediaTek seems to fall out of the norm here with its upcoming X20 SoC, which I'm definitely looking forward to see as to how it behaves in the real-world. We'll also see some vendors revert back to quad-core designs in their custom architectures - while we've yet to get a better picture of how these will behave in terms of performance and power, I think that 4 cores will be a quite reasonable target and sweet-spot for vendors to aim for.

